Current state
This page shows, at a high level, the electricity demand data that DemandCast retrieves and the errors of the forecasts of its models. Its figures and numbers are drawn by plot.py with figure: status (see Analyzing and plotting data).
Data
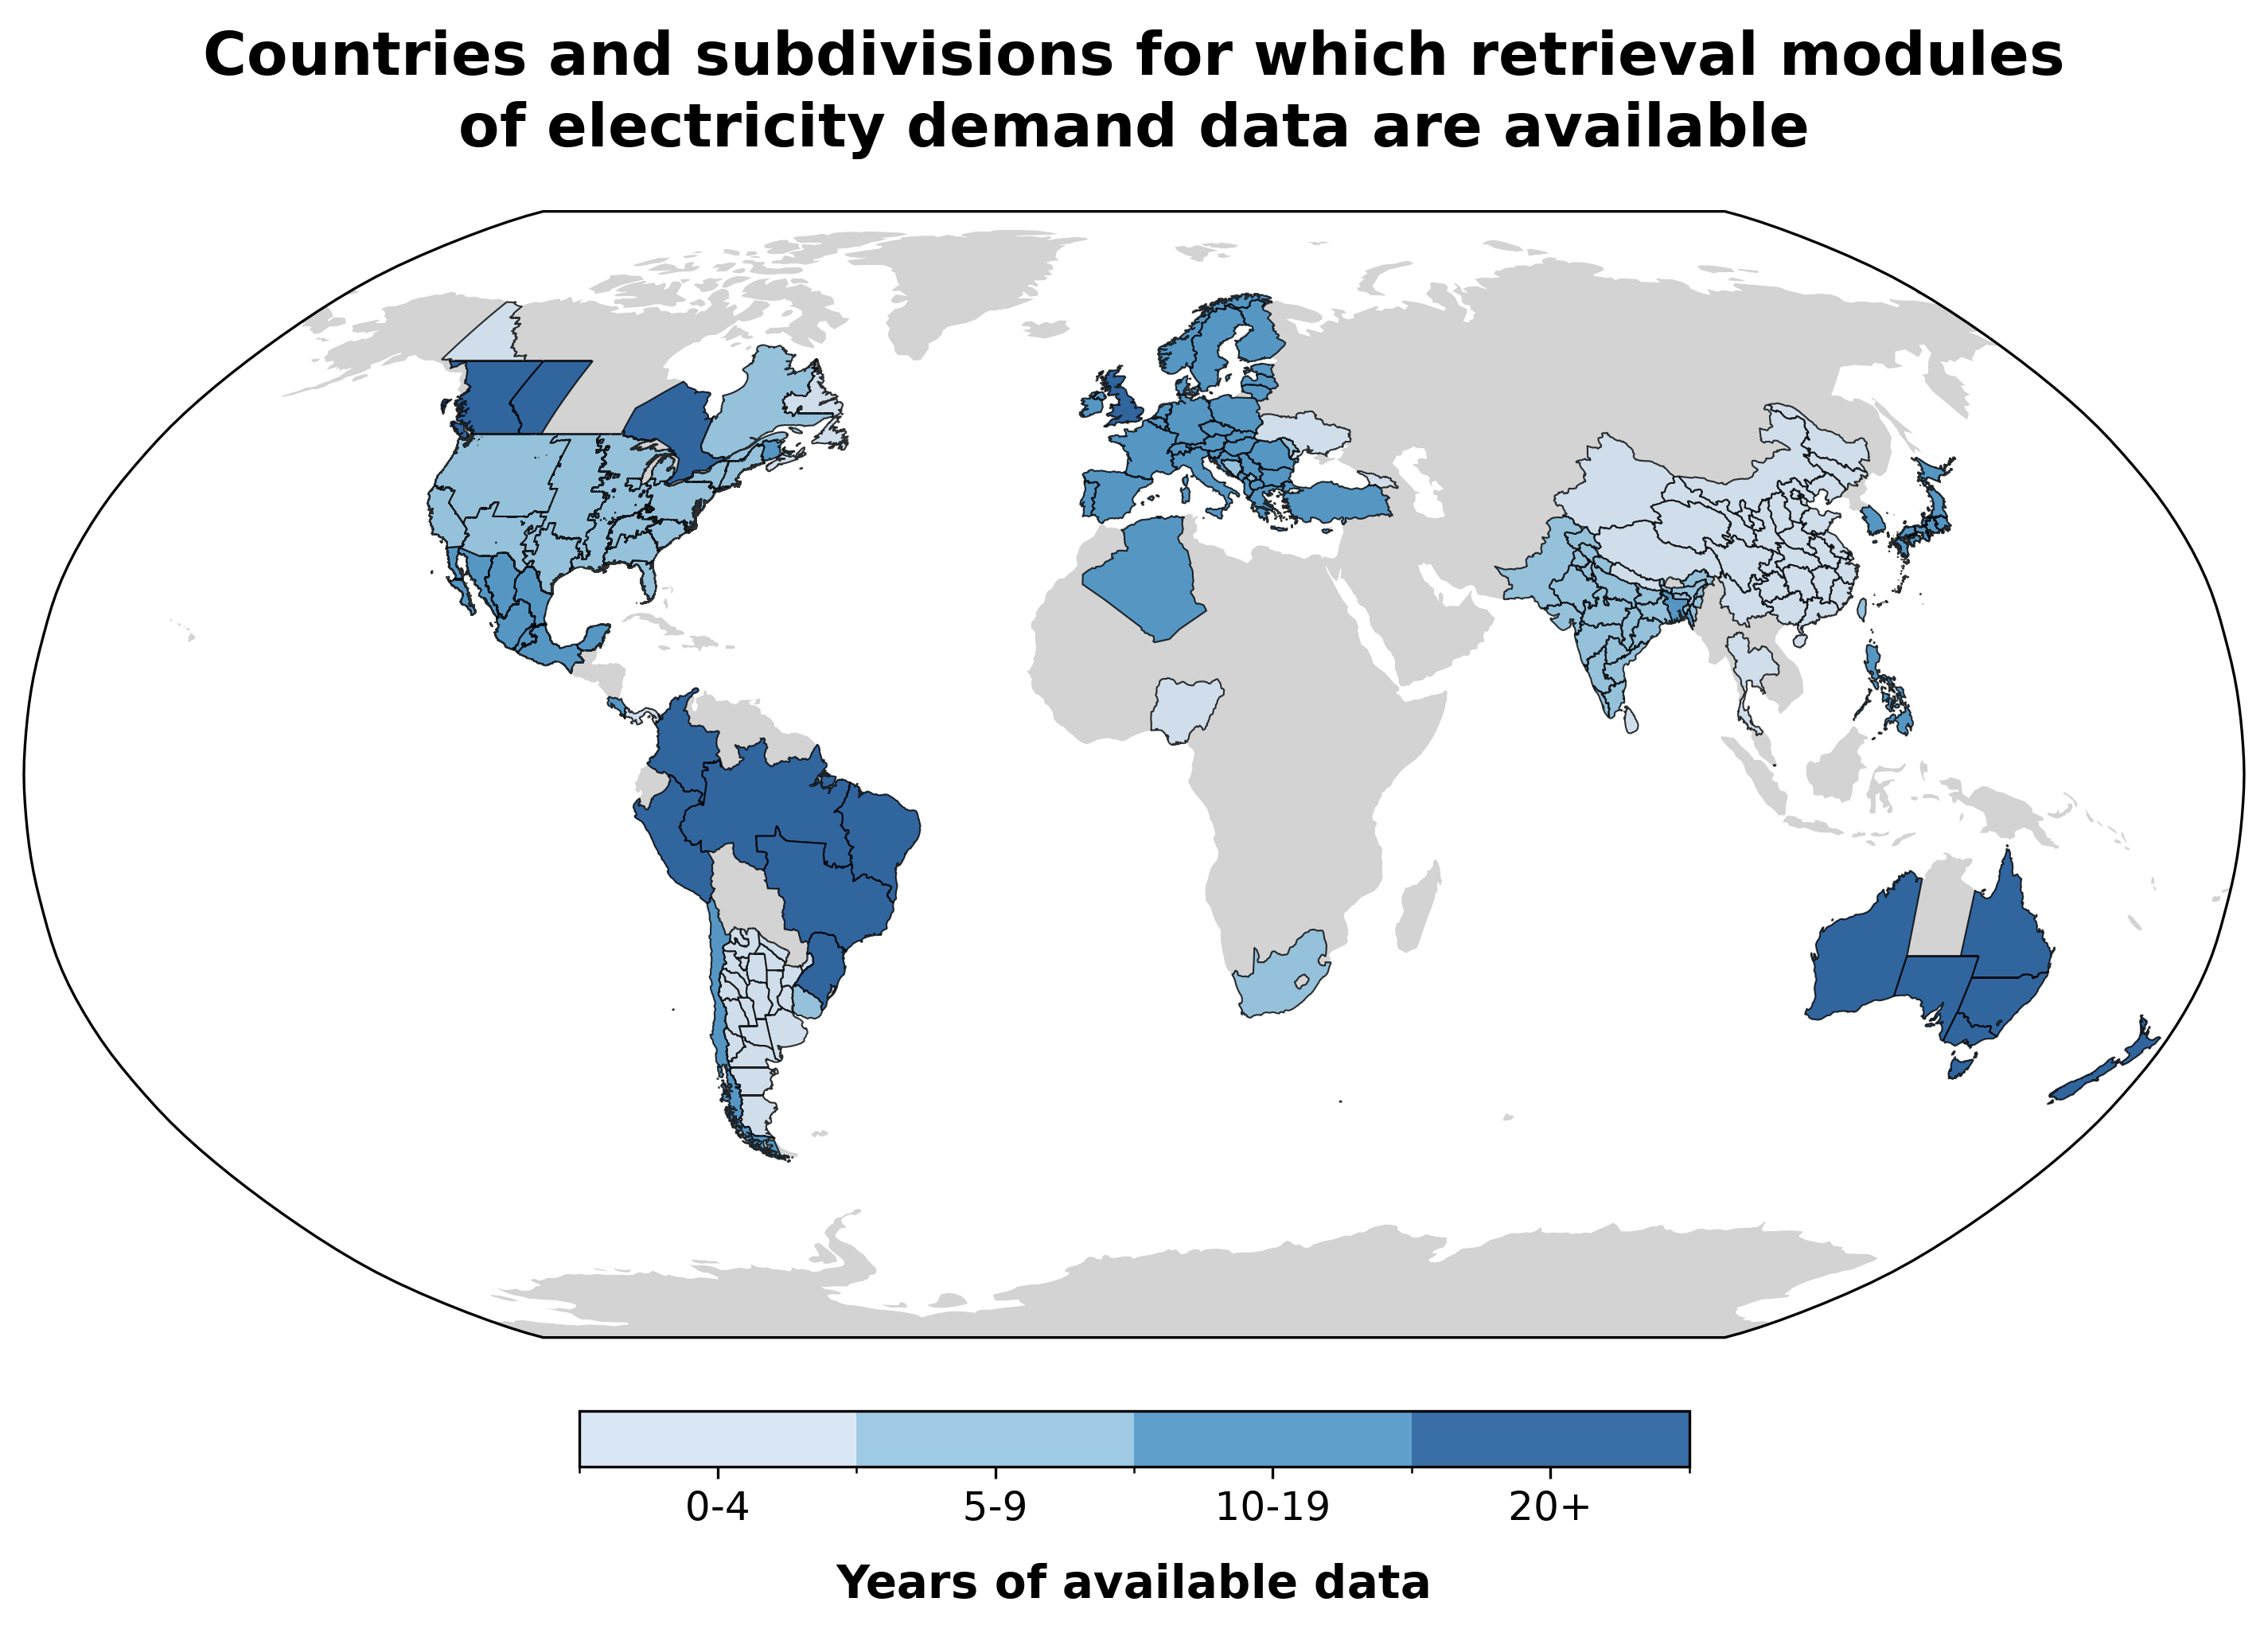
As of 03 November 2026, DemandCast has retrieval modules for the hourly electricity demand of 57 countries and 138 subdivisions, in 67 countries, from 43 data sources, with about 1,678 years of data in total since 1994, in the periods that the data sources cover, before the cleaning and the selection of the complete years for training.
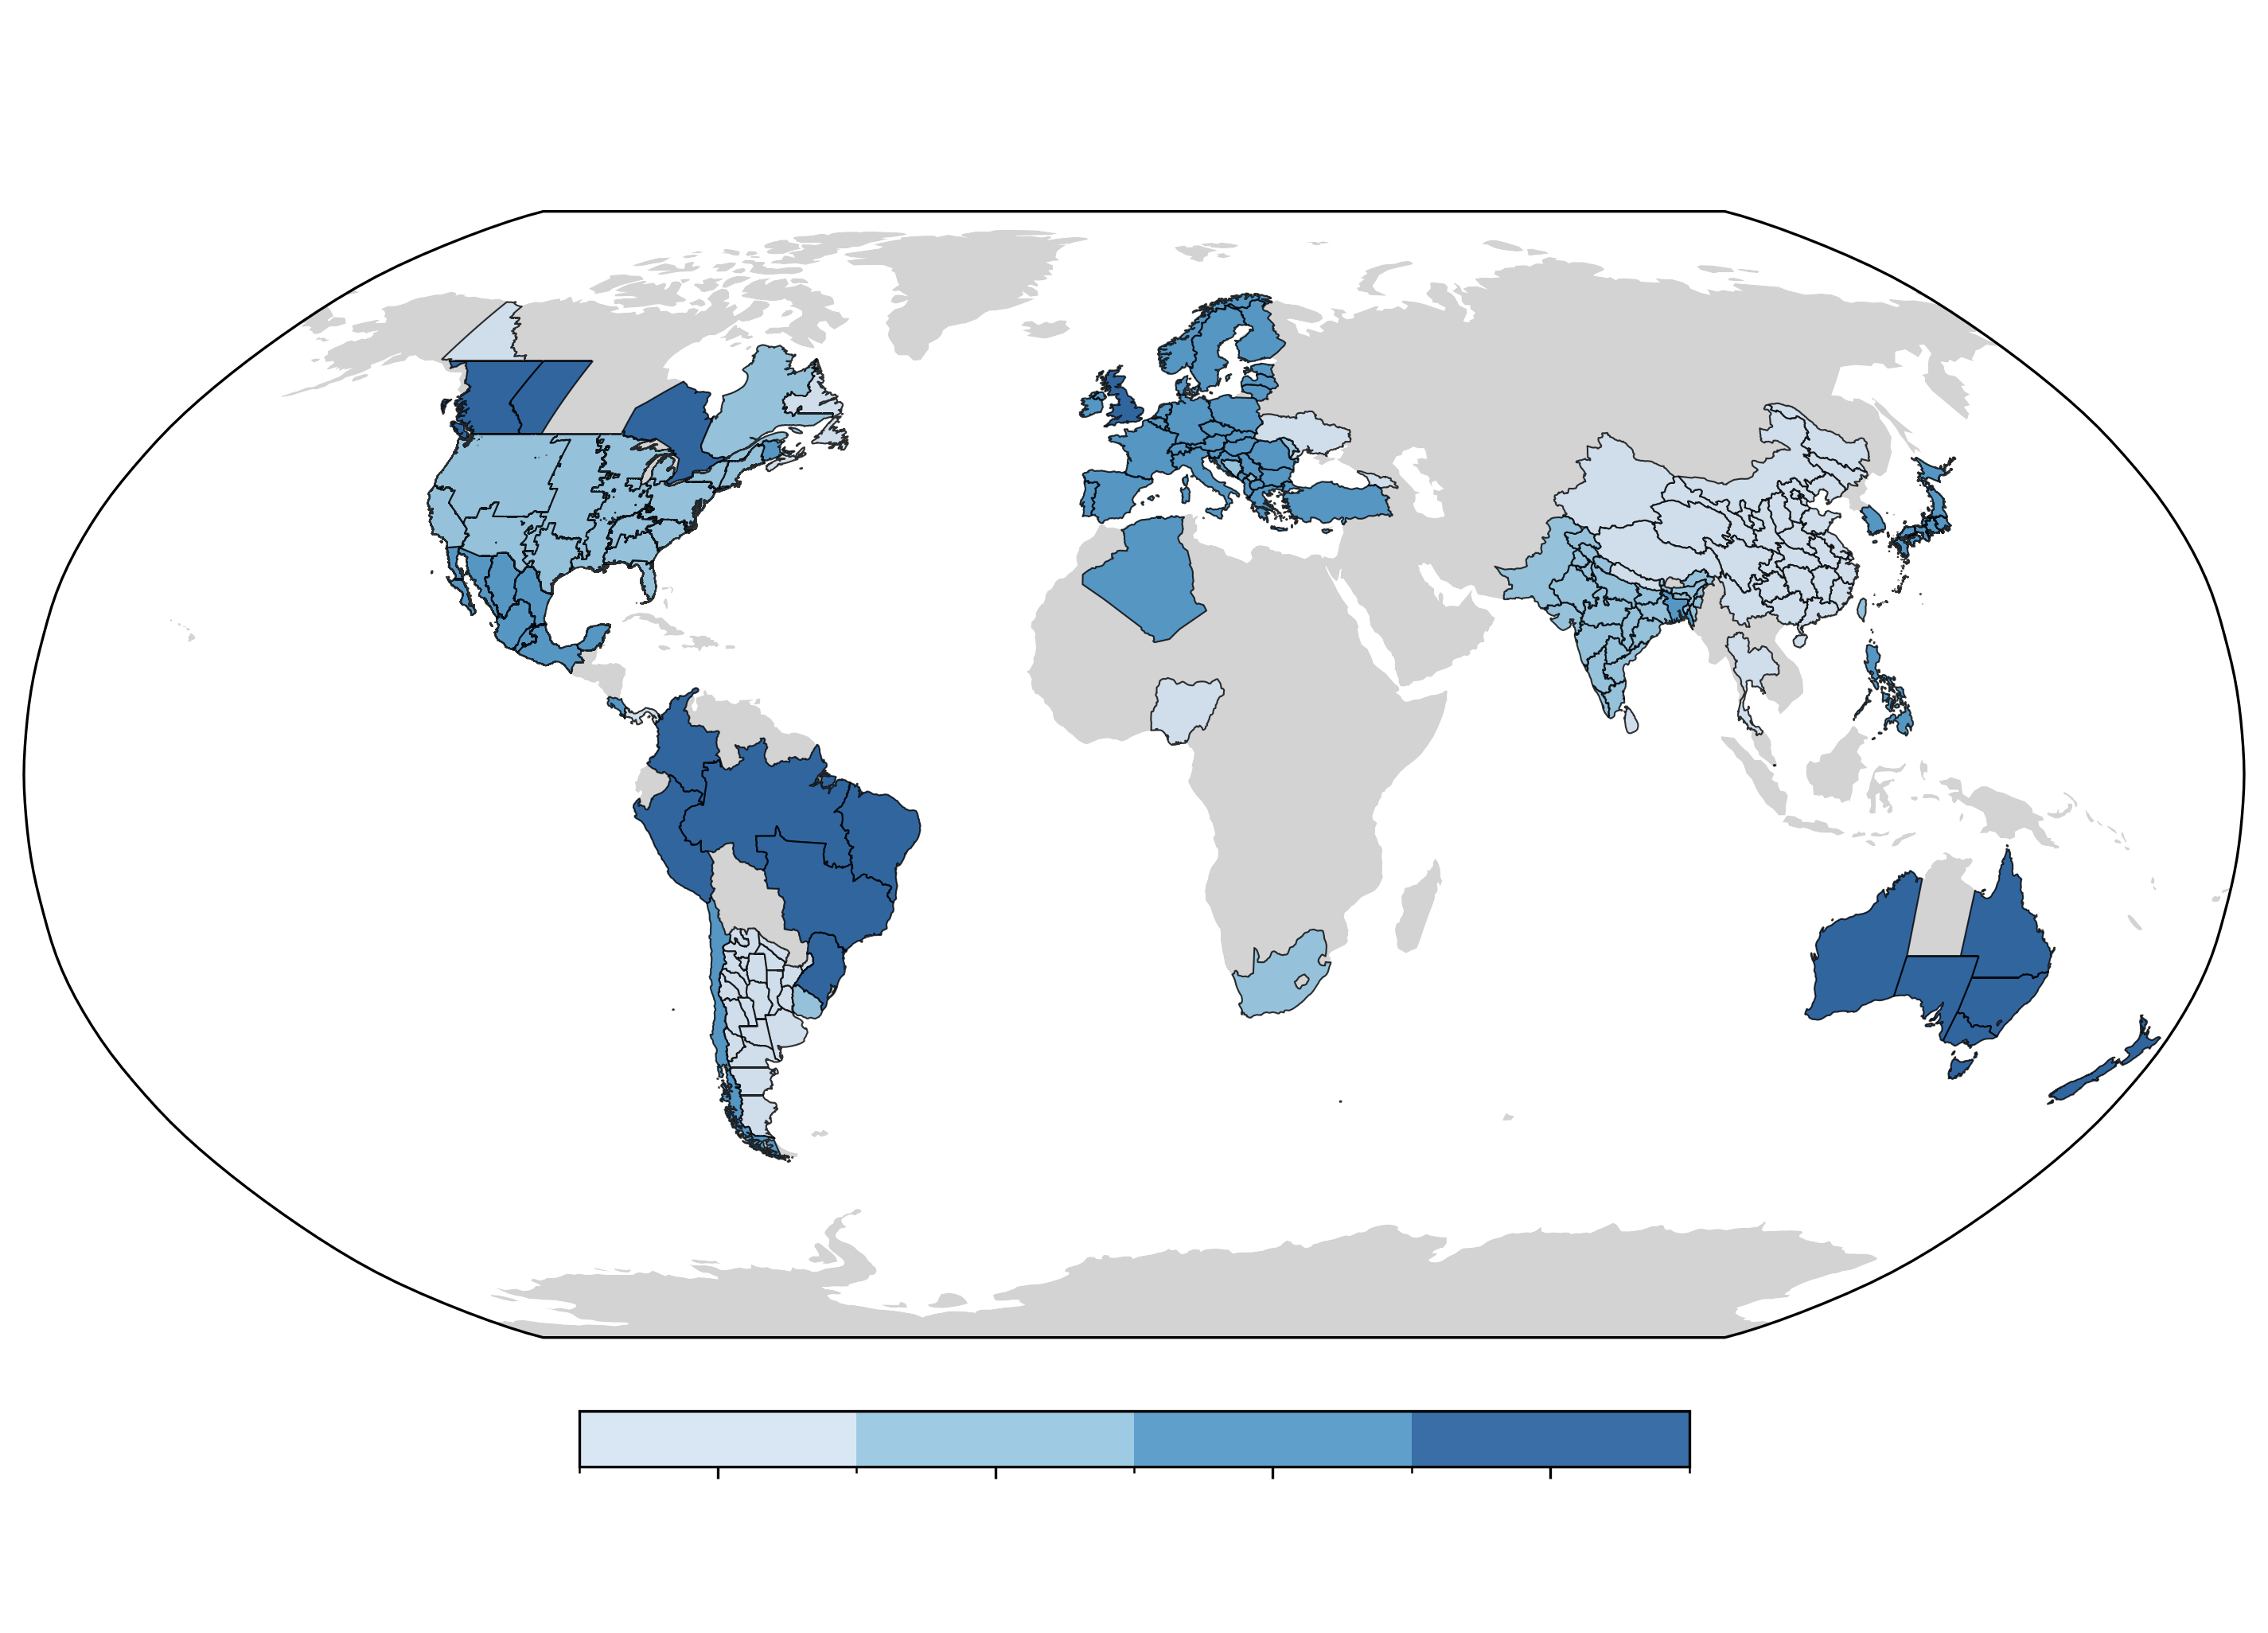
The map shows the countries and subdivisions for which retrieval modules of electricity demand data are available, with the years of their data.
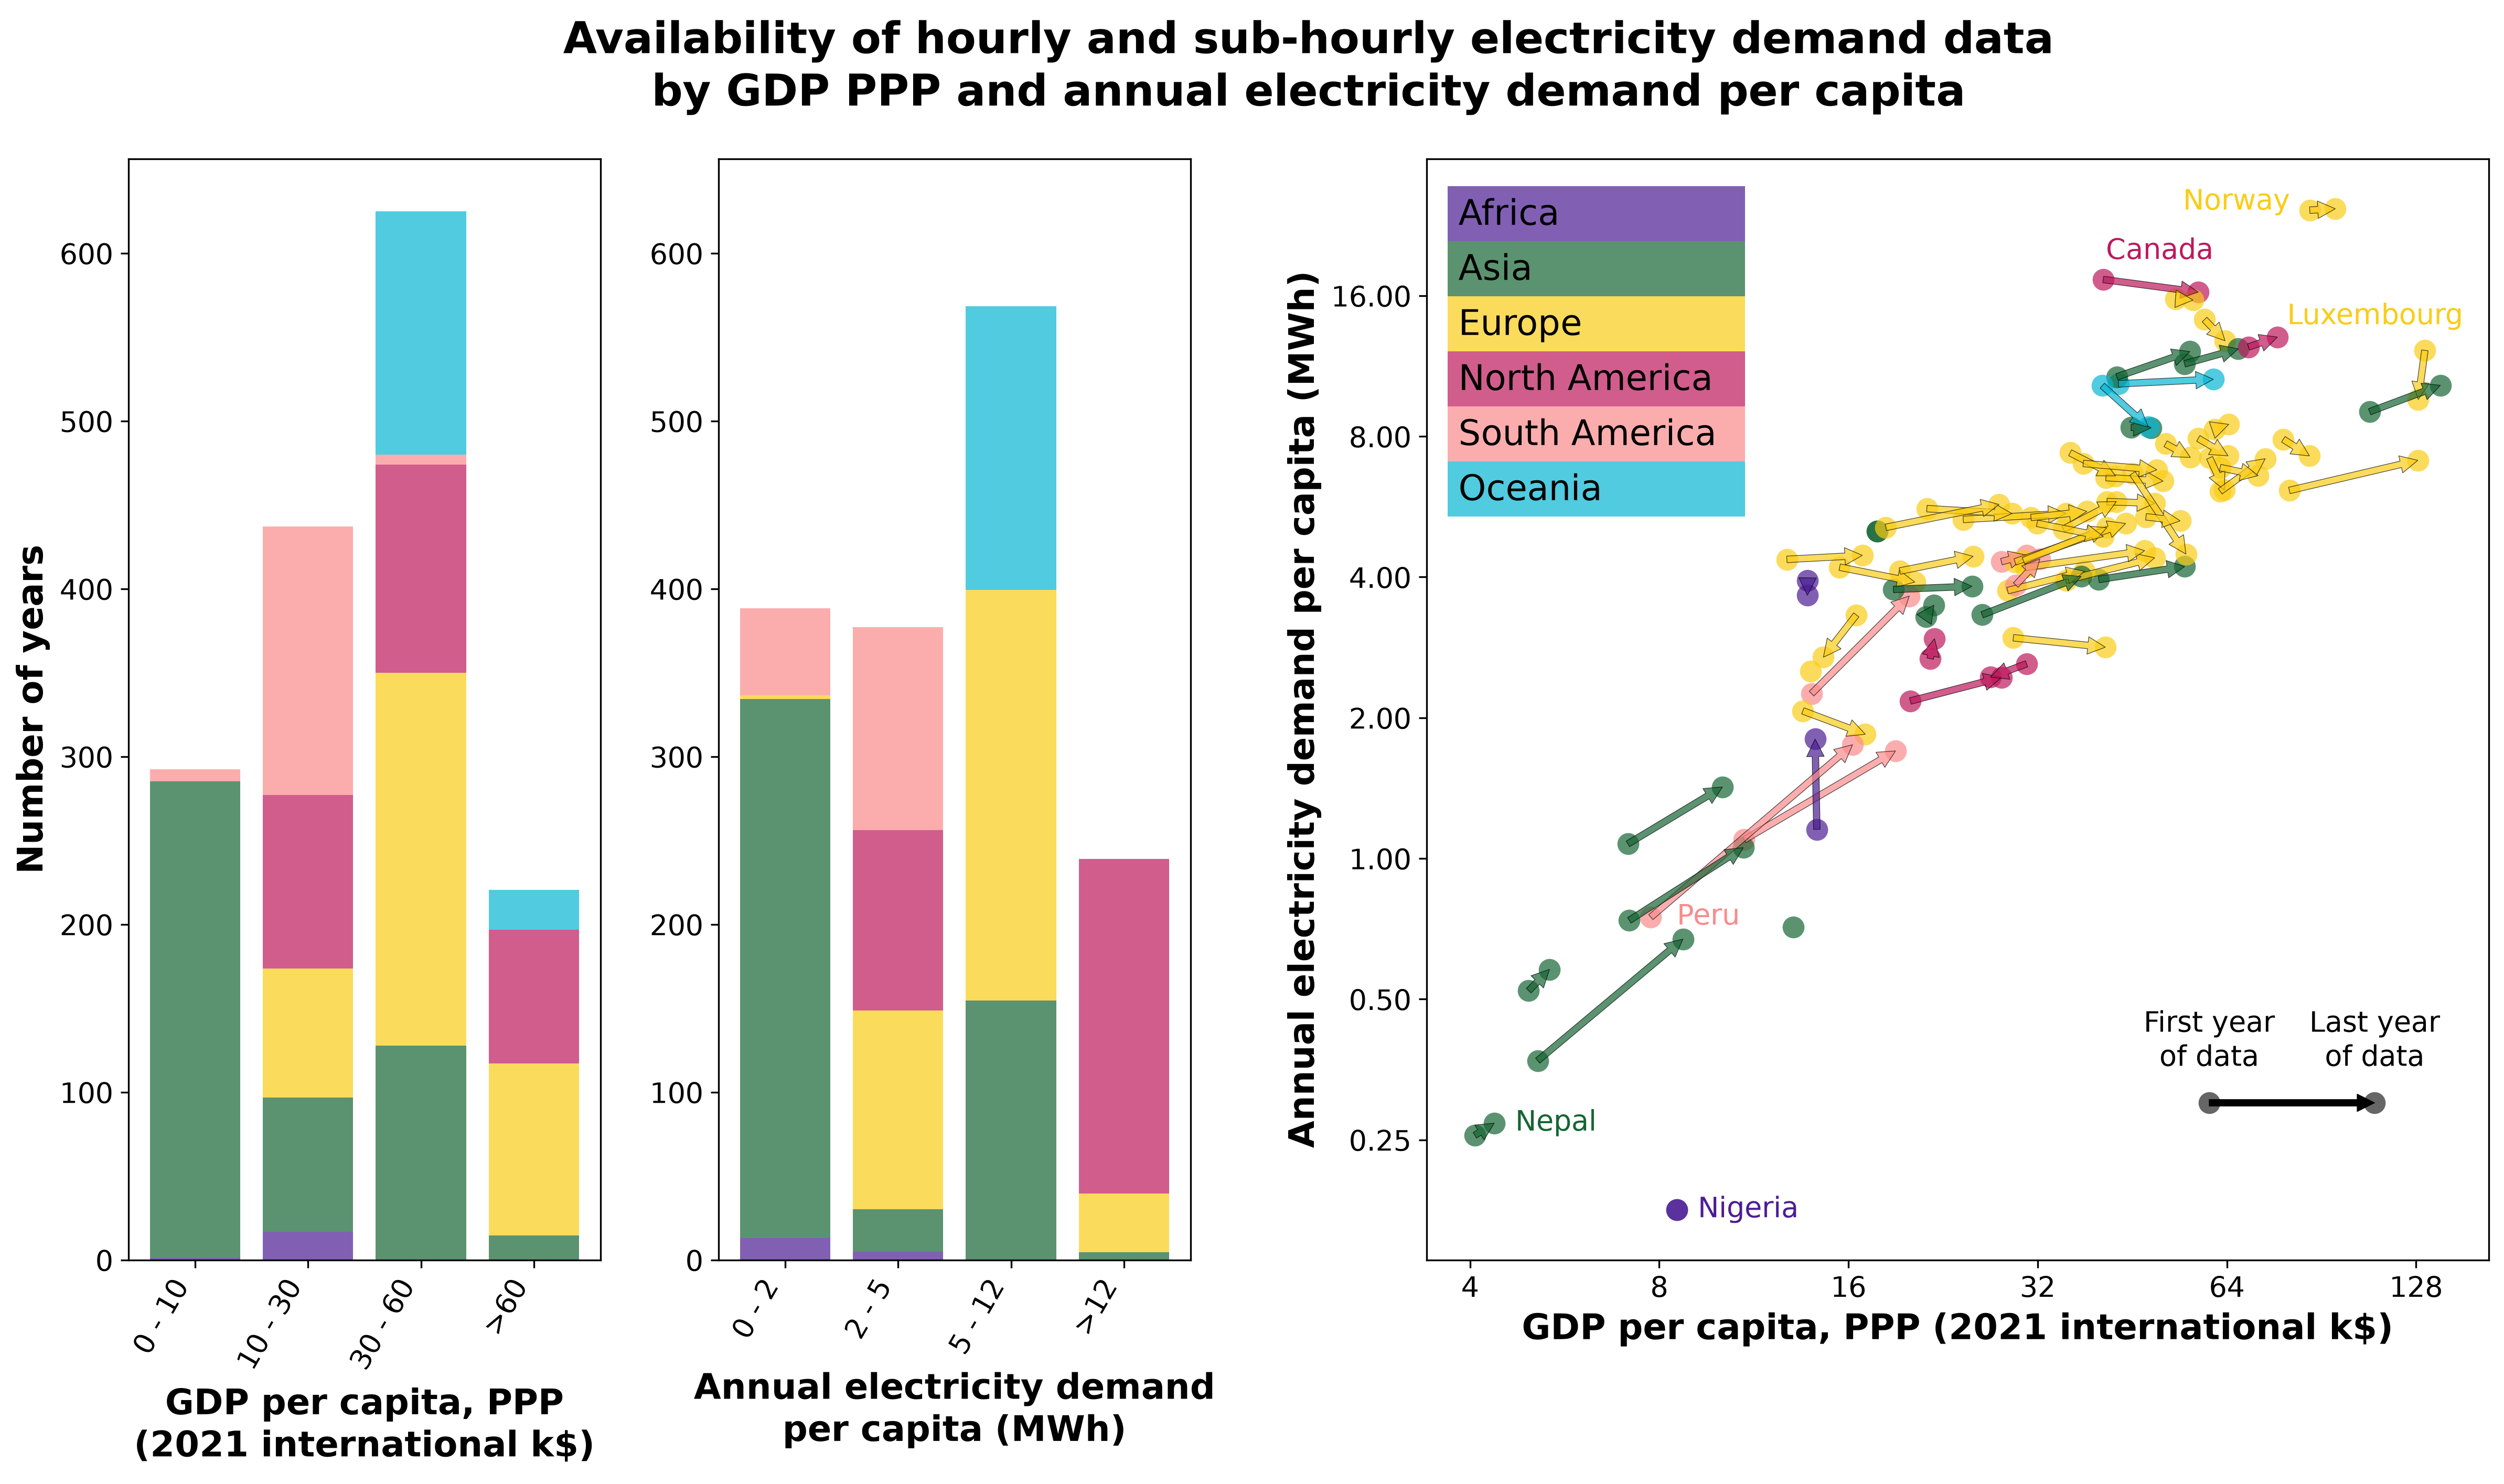
The figure below shows the years of data of the countries and subdivisions by GDP PPP per capita and by annual electricity demand per capita of their country, by continent, and how these changed in each country between its first and last year of data. It shows which kinds of countries and subdivisions the training data covers, and therefore where the models extrapolate when they forecast the demand of those without data.
The data retrieval page describes the data sources, and how their data is cleaned and combined.
Forecast errors
The models forecast the hourly electricity demand of each year of a country or subdivision. Their error is the weighted absolute percentage error (WAPE): the sum of the absolute differences between the forecast and the actual hourly demand, divided by the sum of the actual demand. Lower is better.
The models are scored in two ways: a validation, on the most recent year of the countries and subdivisions with data, and a cross-validation, on countries and subdivisions whose data the model never saw. Each trains XGBoost models on the data above, without the data that it scores them on, which its section describes.
Validation
The validation trains the model on all the years of data but the most recent one of each country and subdivision, and scores it on that year. The countries and subdivisions with a single year of data are only scored, so the model never saw them in training. It tells how well the model forecasts a new year of the places it learned from.
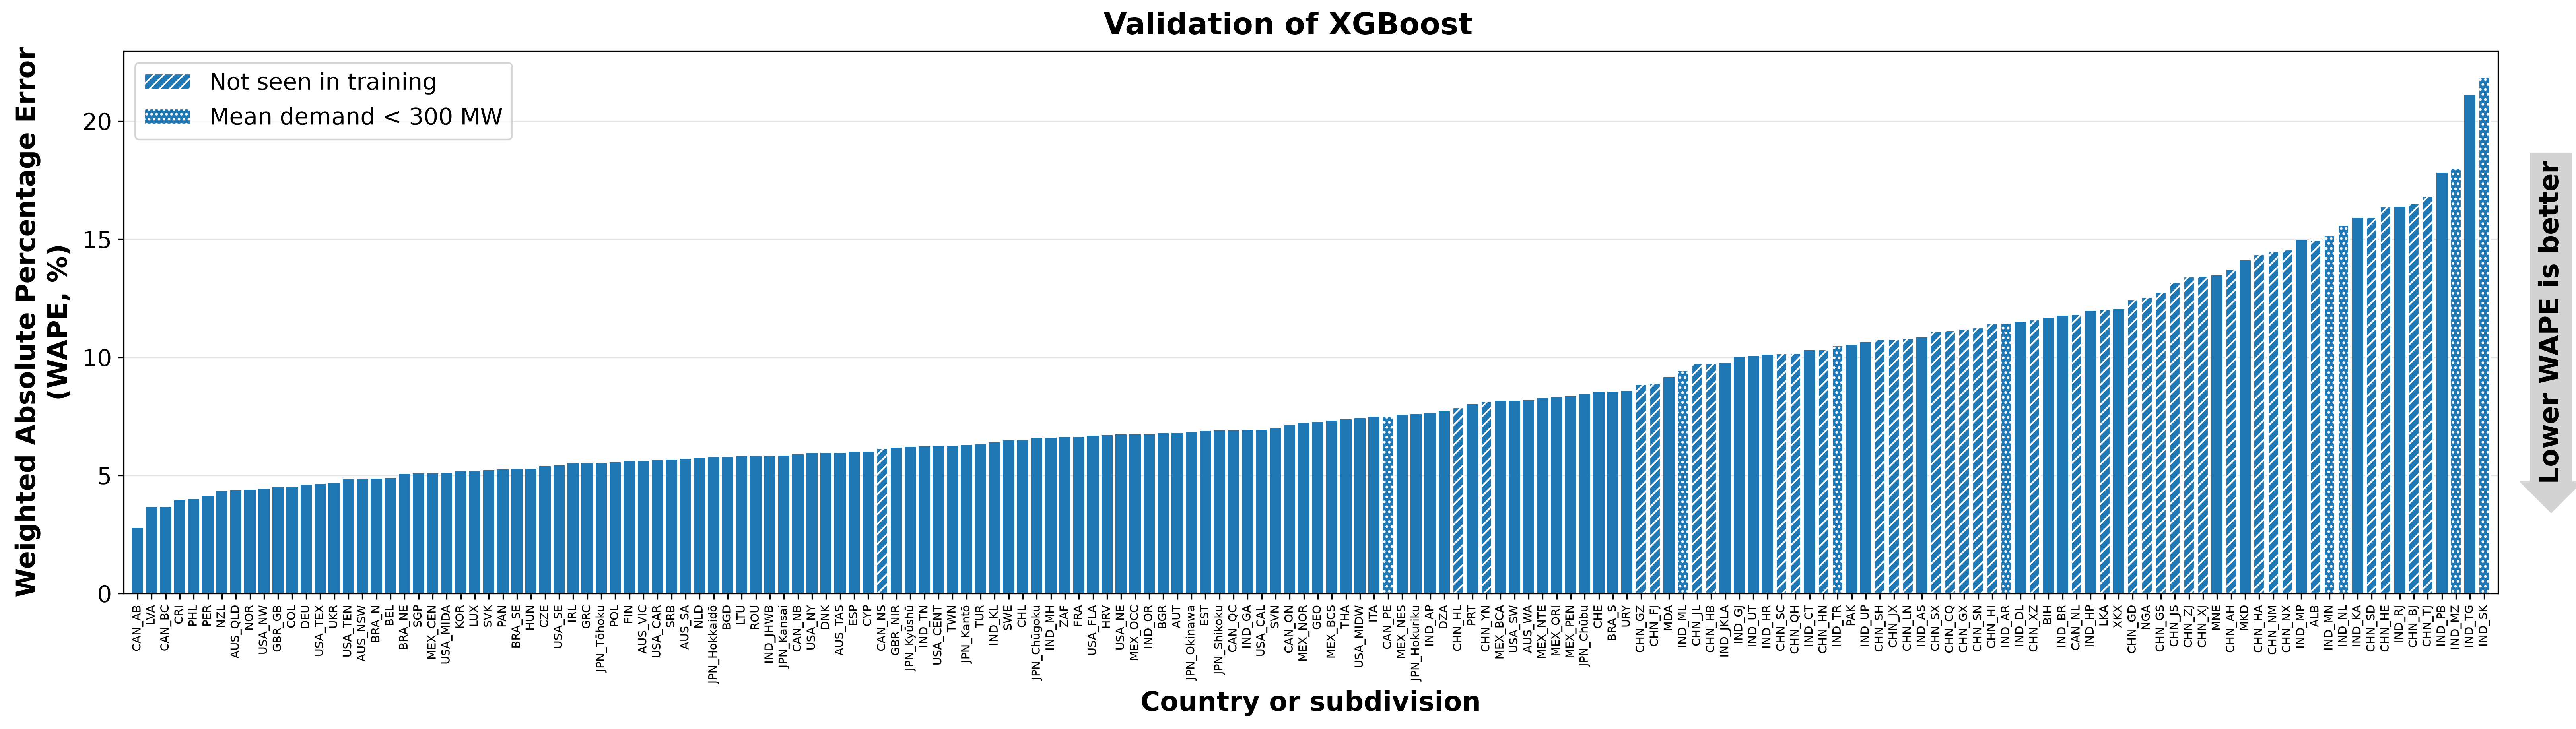
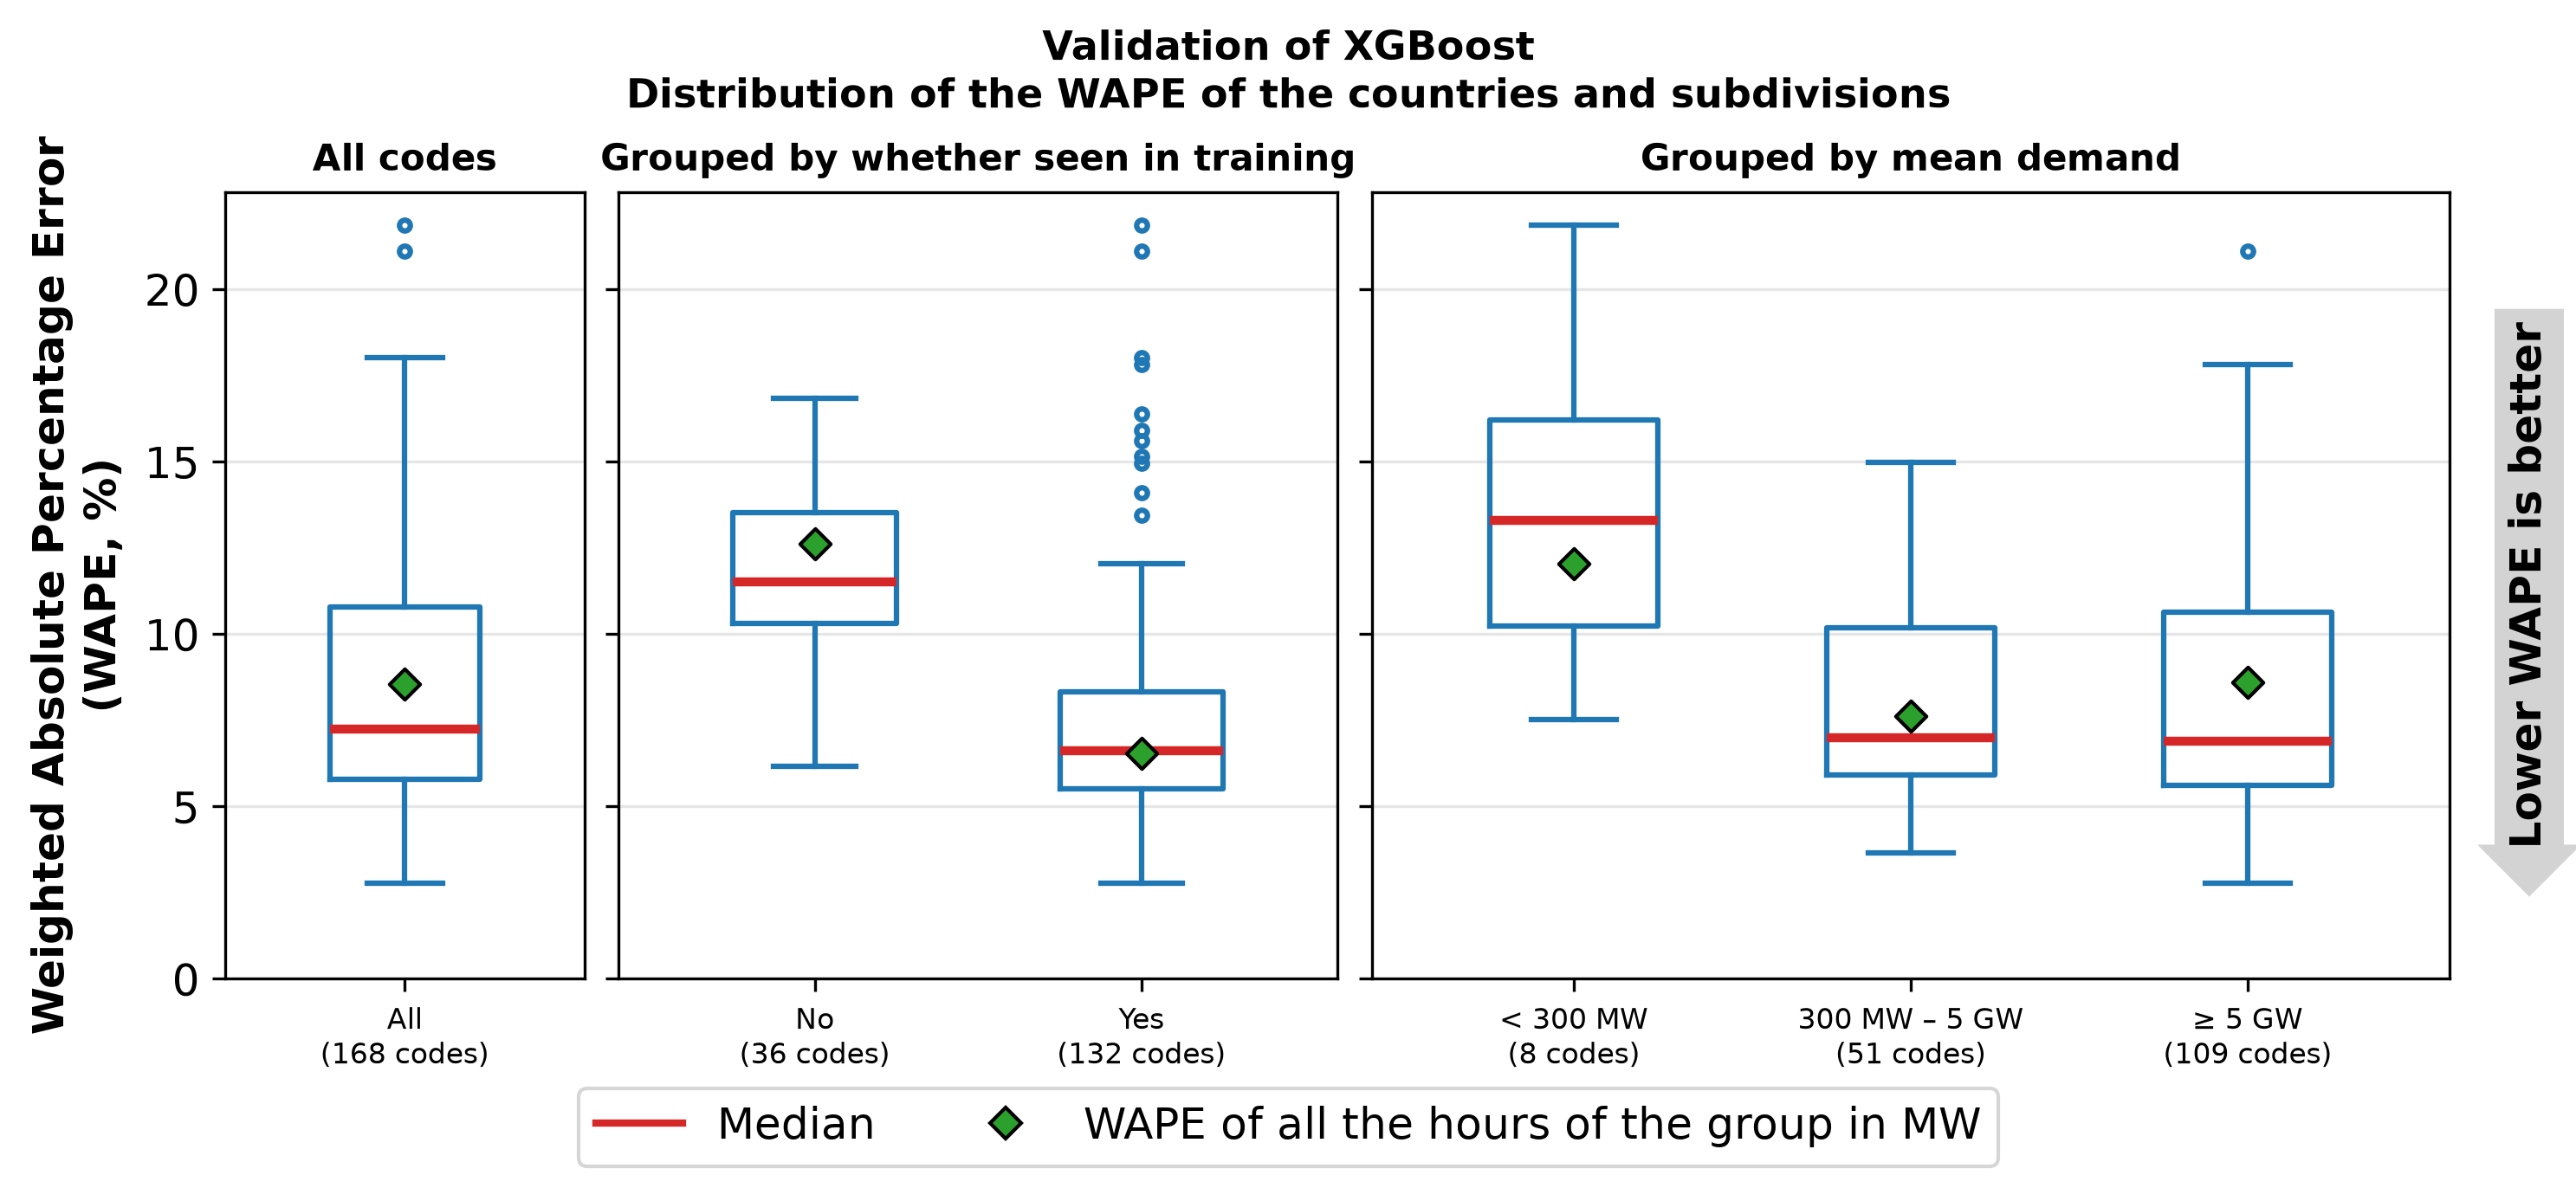
In the validation of XGBoost, the median WAPE of the countries and subdivisions is 7.2%: 6.6% for those whose other years the model saw in training, and 11.5% for those that it never saw.
Each bar is the error of a country or subdivision, hatched with lines if the model never saw it in training, and with dots if its mean demand is below 300 MW.
The boxes show how the errors spread: for all the countries and subdivisions, for those that the model saw in training or not, and by mean demand. The red line is the median of the group, and the green diamond the error of the group as a whole, in which the largest systems weigh the most.
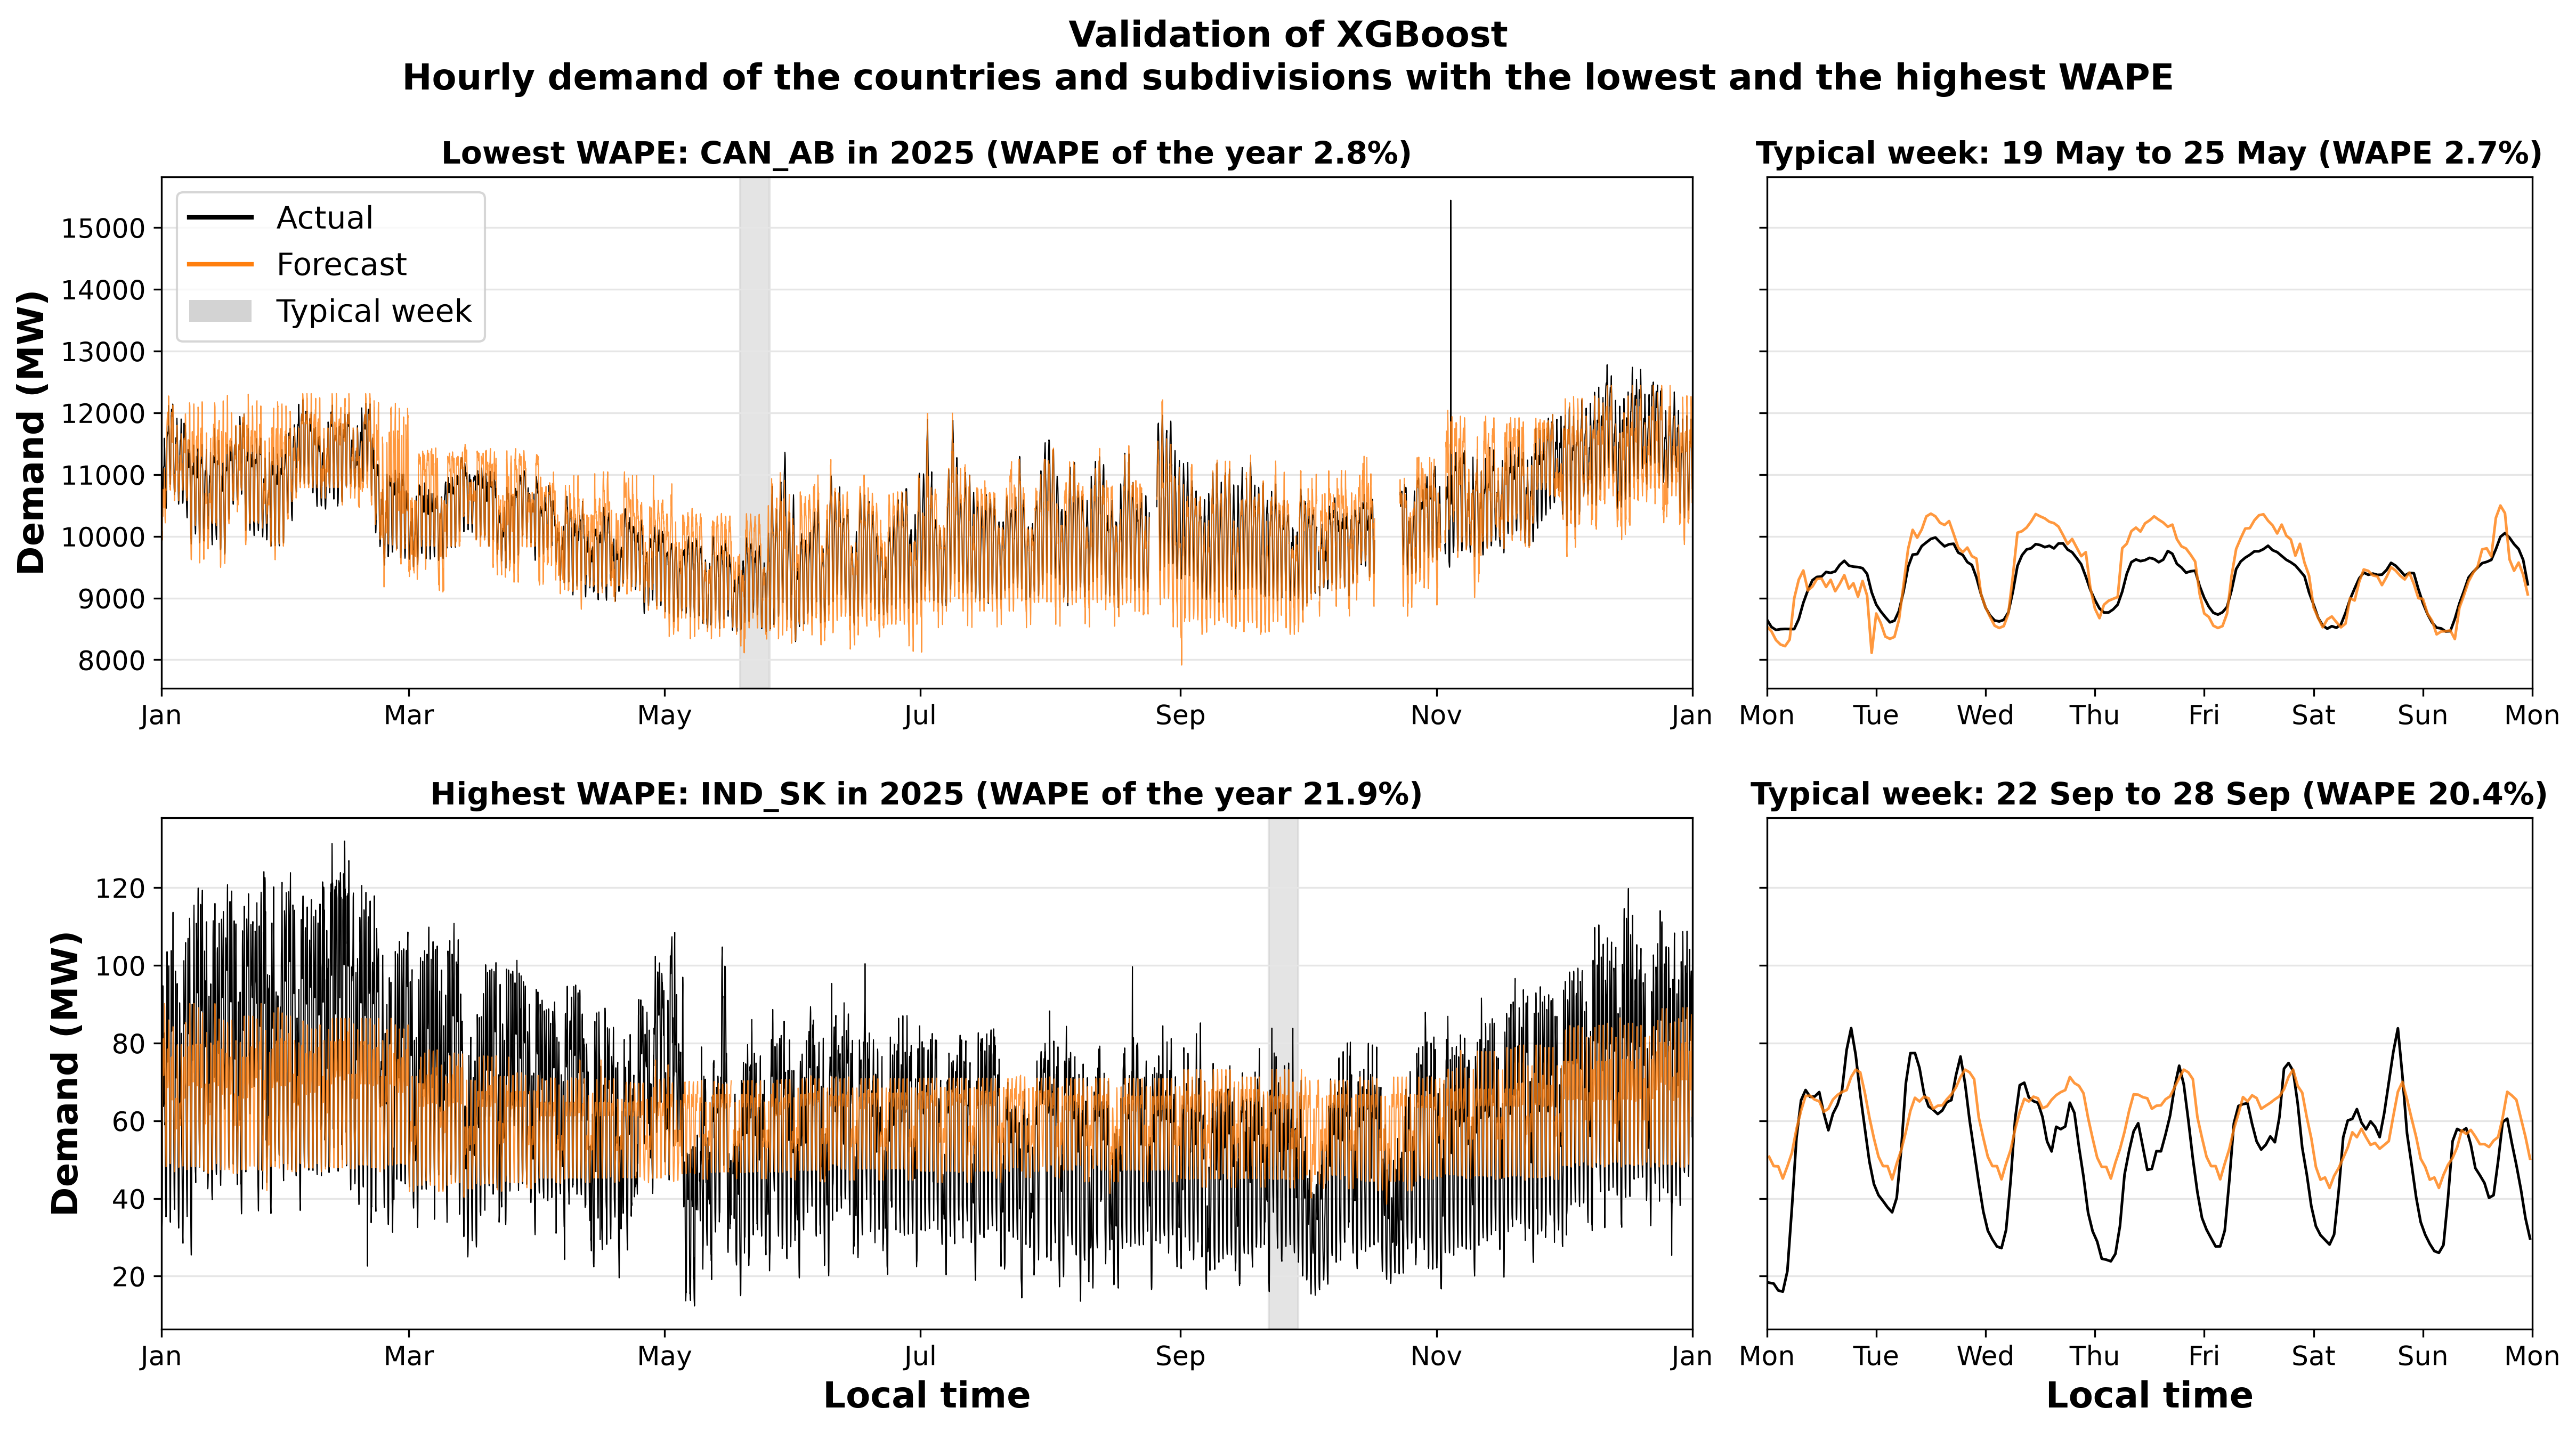
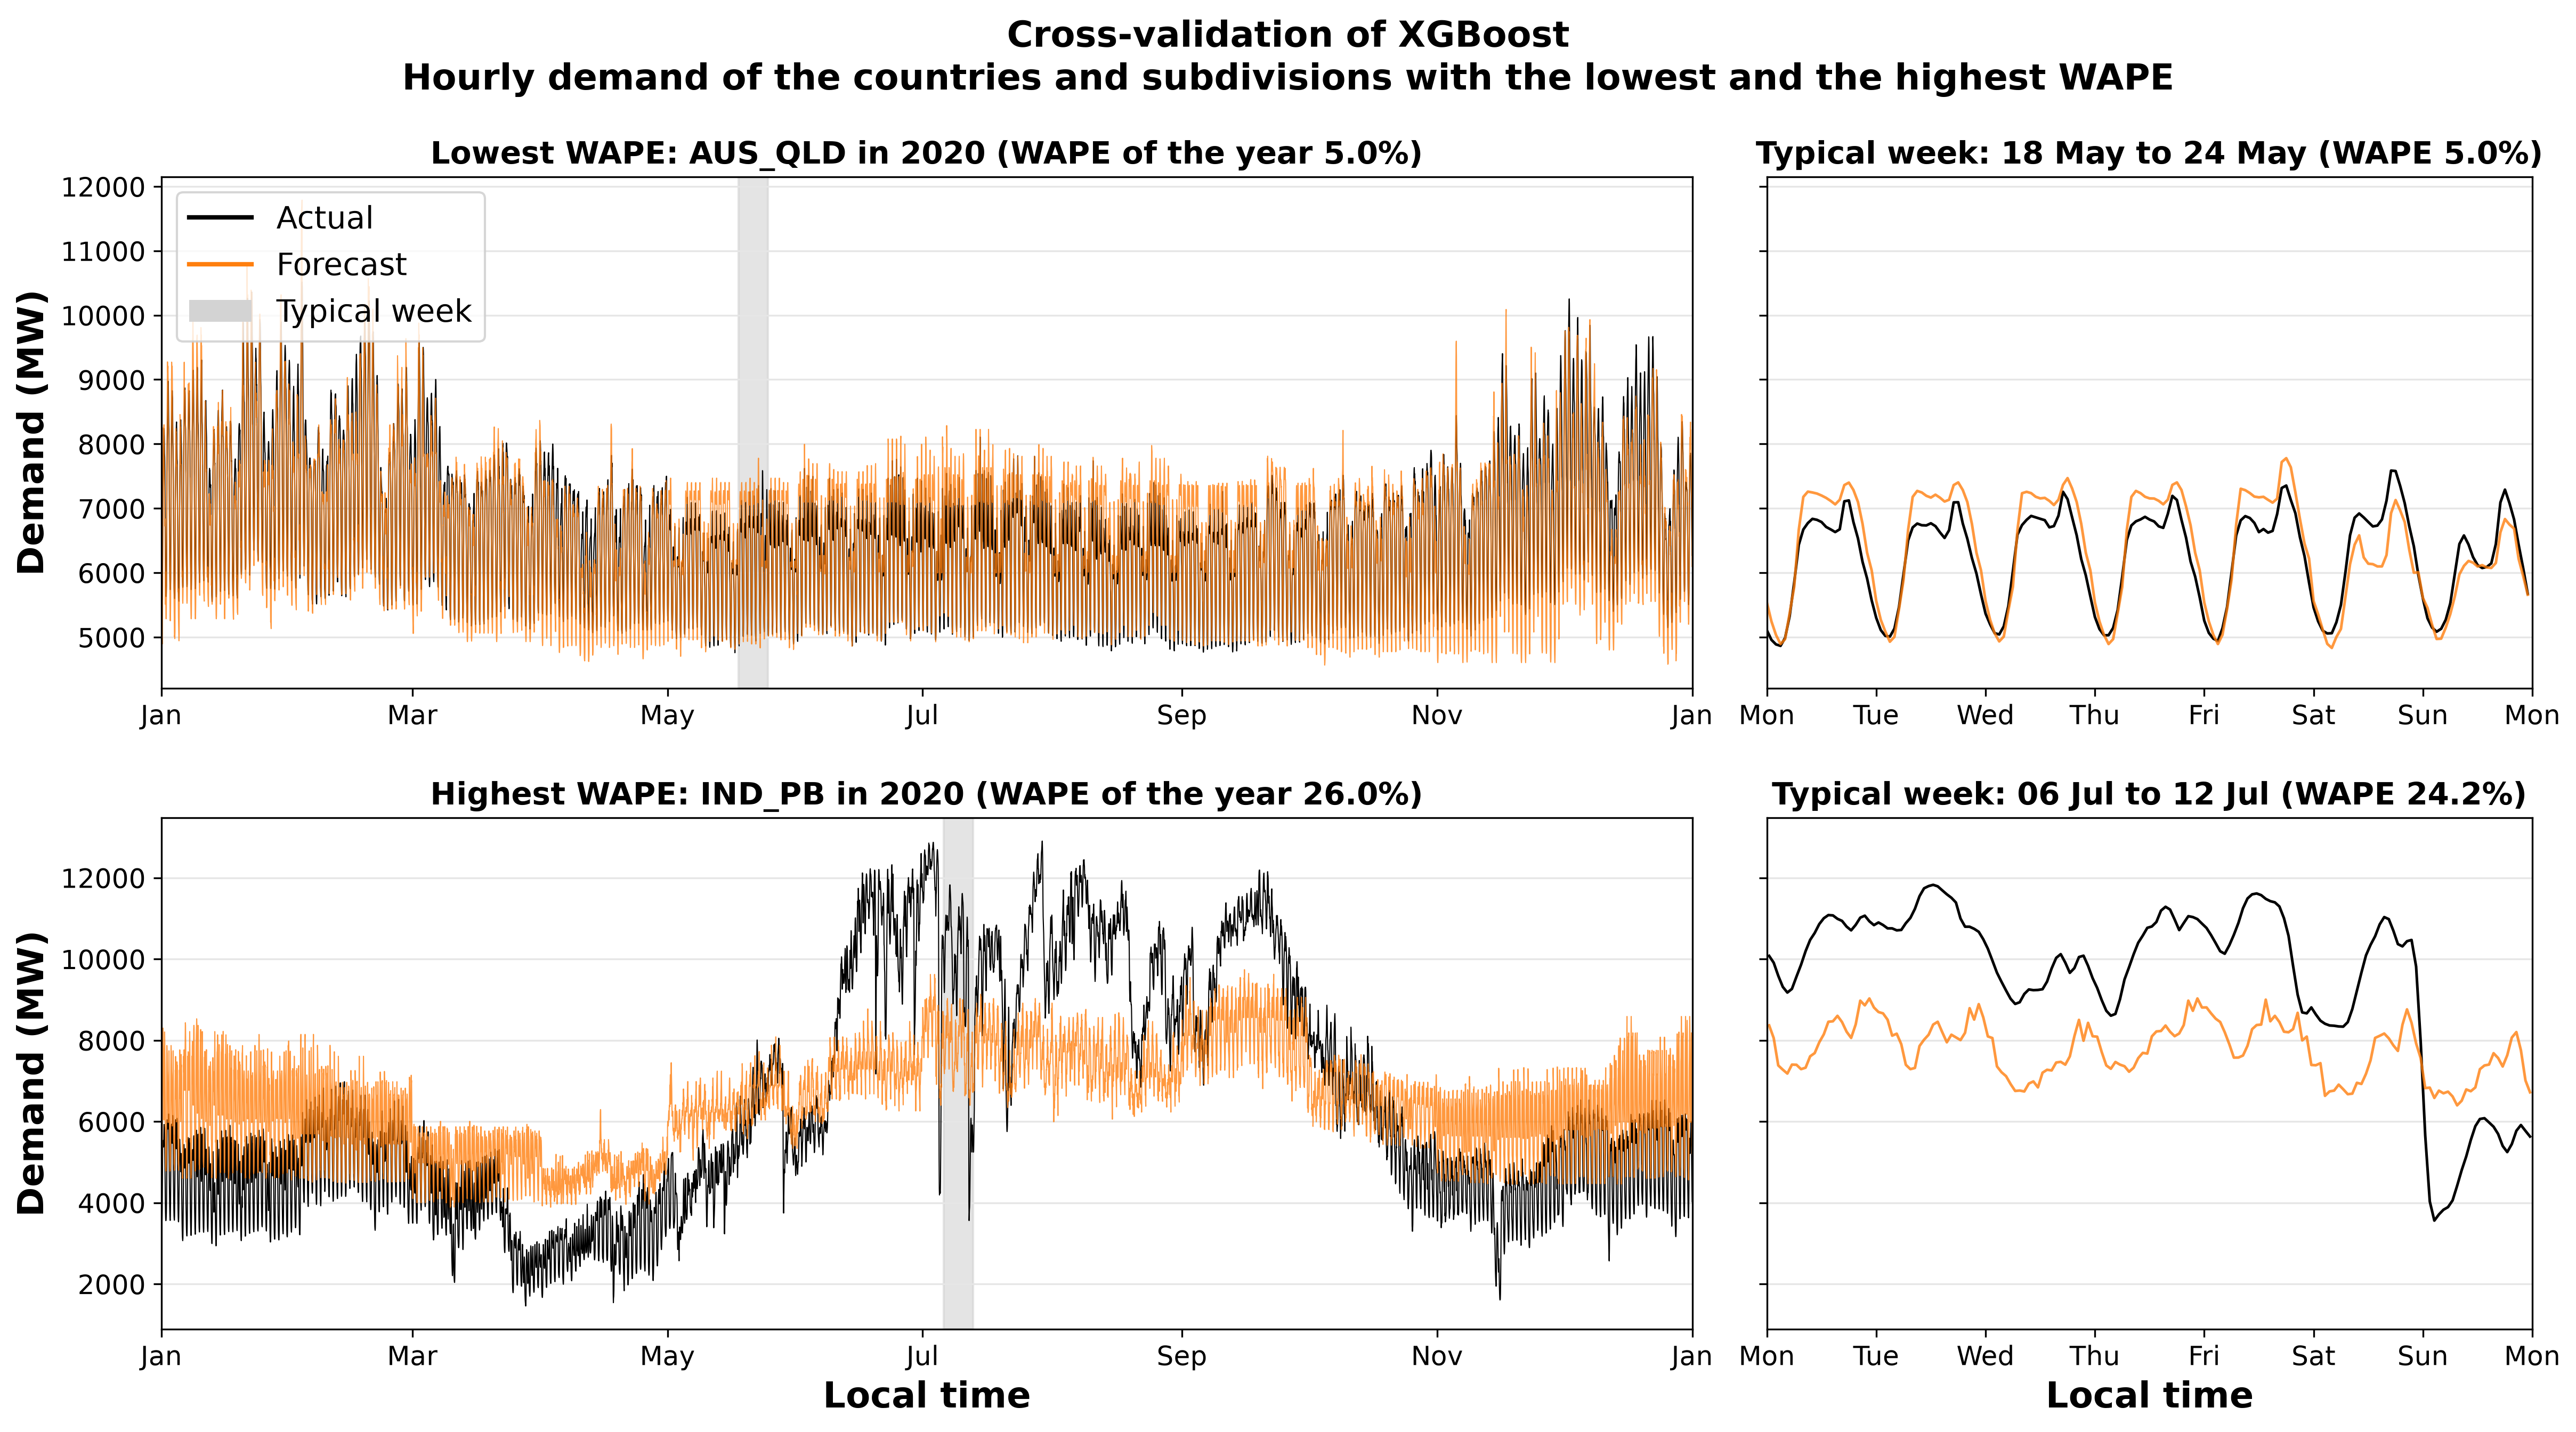
The figure below compares the actual hourly demand with the forecast for the country or subdivision with the lowest error and for that with the highest: over a full year on the left, and on the right over its typical week, from Monday to Sunday, whose error is the median of the weeks of the year, shaded in the year. The forecast has the annual demand of the actual one, so the two differ by the error of the hourly profile, which the WAPE measures.
Cross-validation
The cross-validation scores the models on data that they never saw. It tells how well they forecast the countries and subdivisions without data.
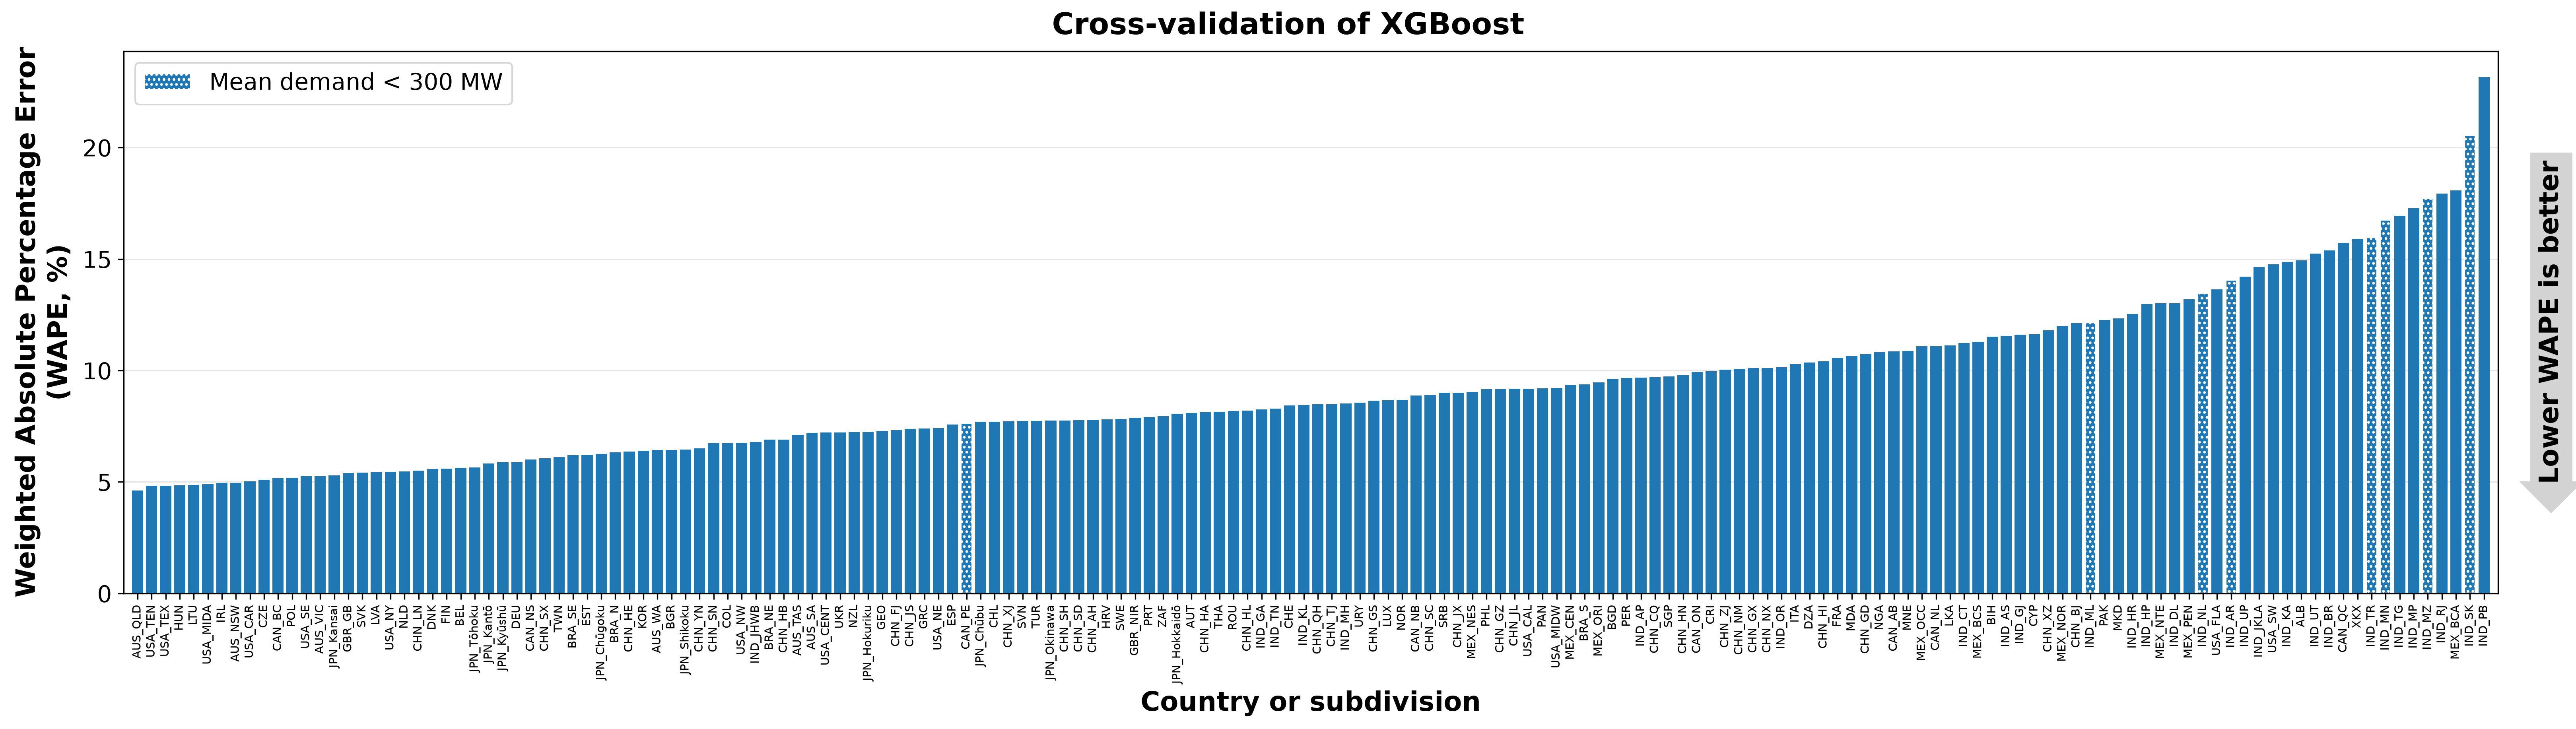
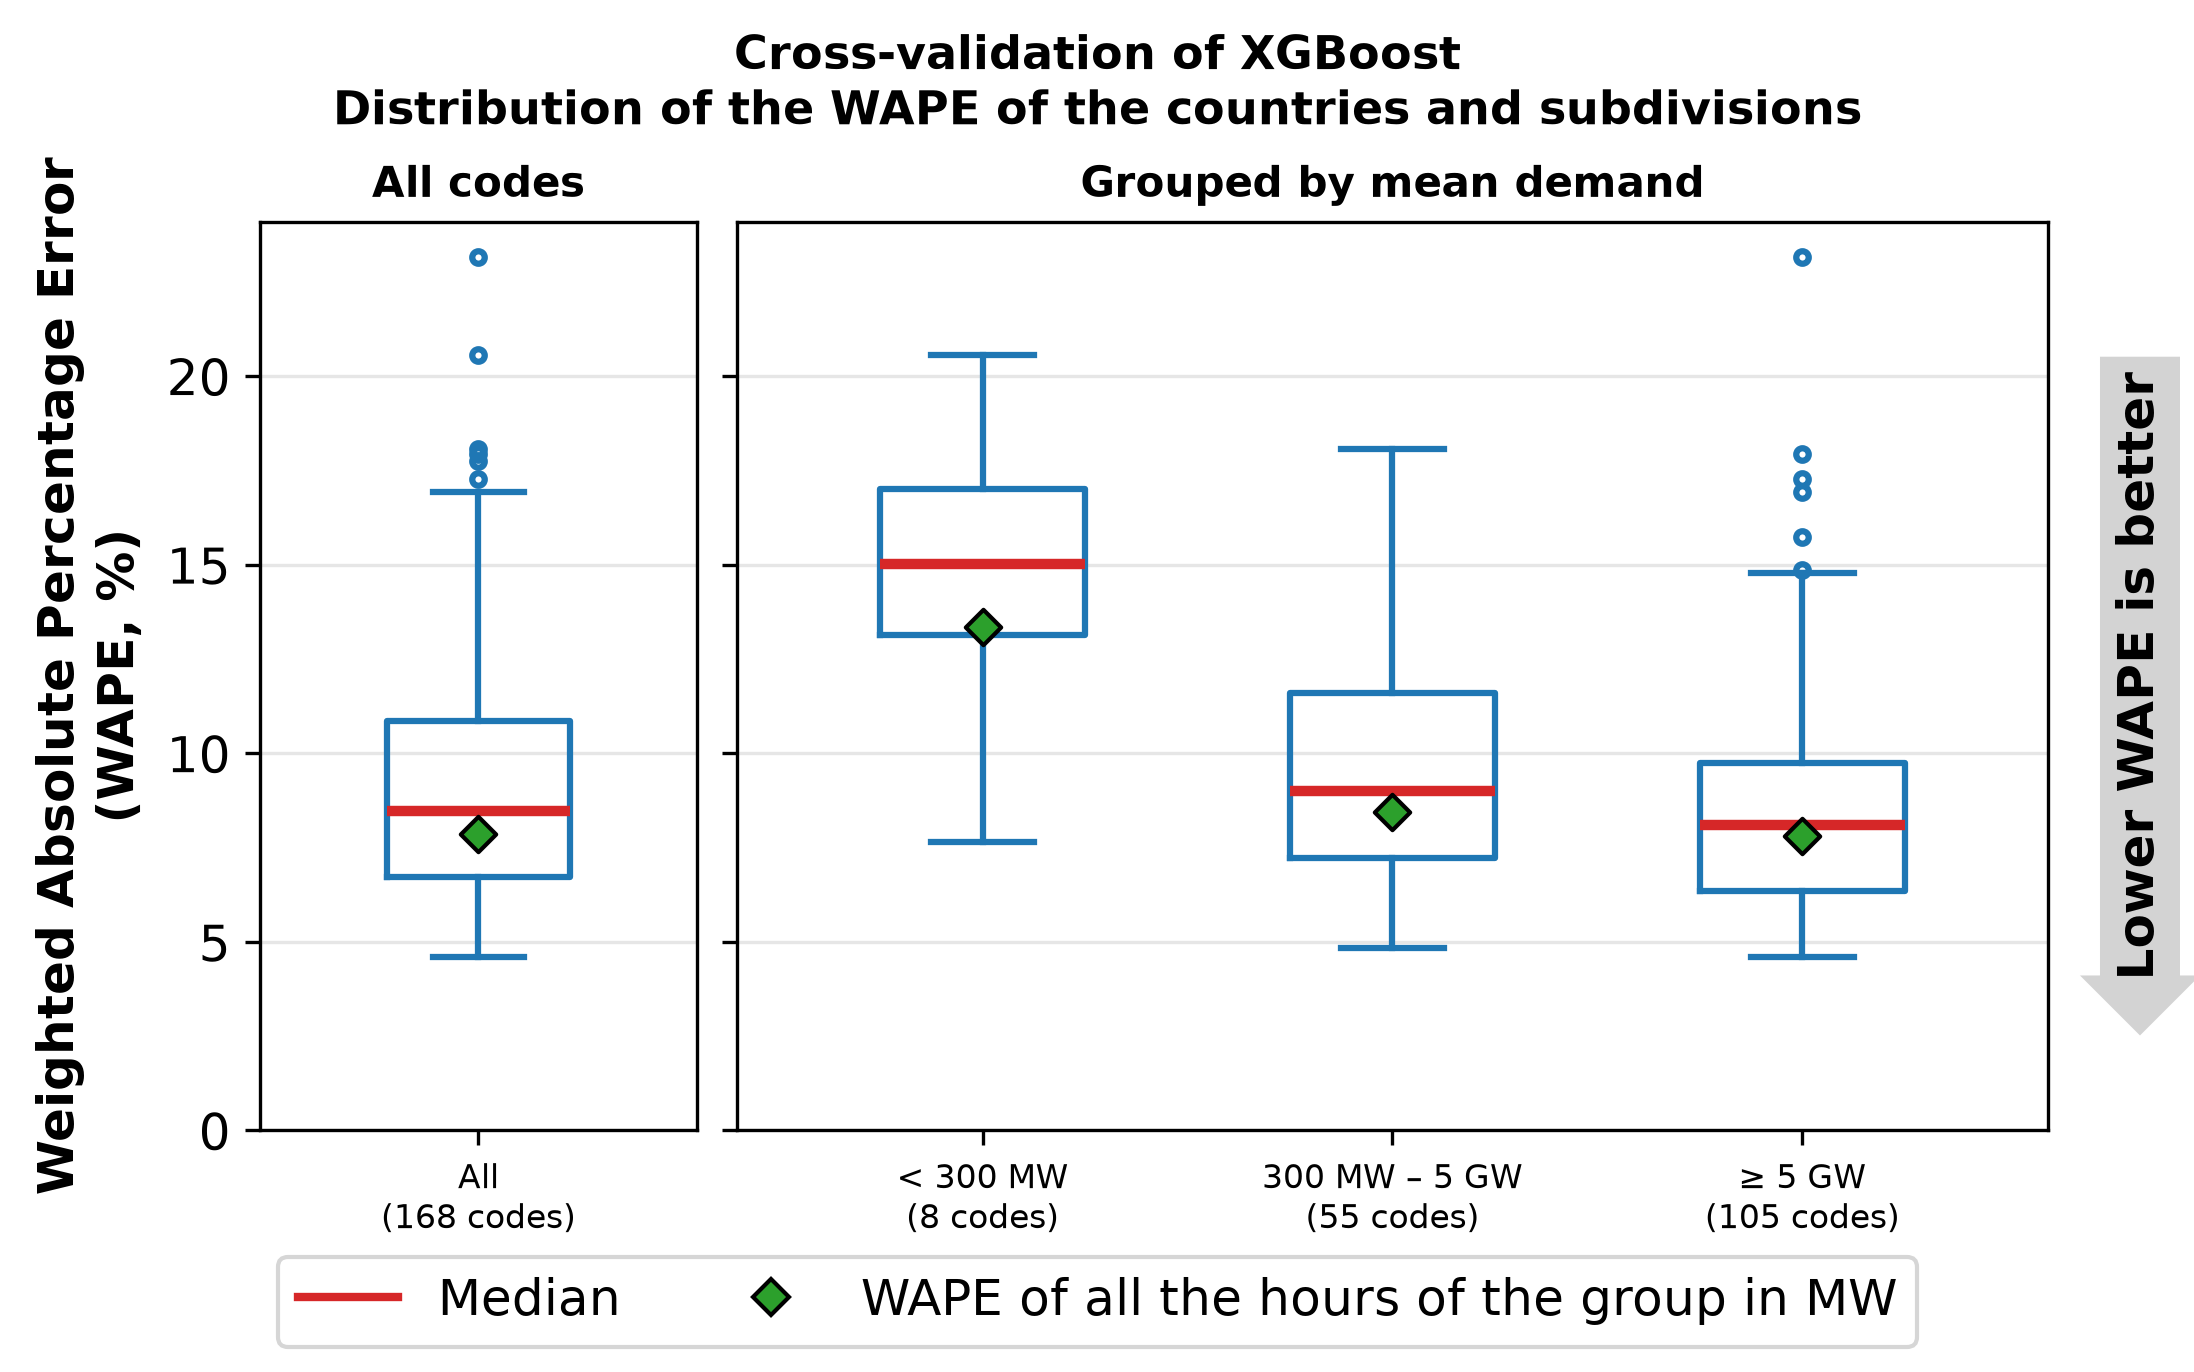
The cross-validation of XGBoost leaves each country or subdivision out of the training in turn, and the median WAPE of the 168 held-out countries and subdivisions is 8.5%, an estimate of the error for a country or subdivision without data, whose country can have data of its other subdivisions.
The figures show the error of each country and subdivision, their distribution, and the actual and forecast hourly demand of those with the lowest and the highest error, as for the validation.
The machine learning page describes the models and how they are validated.