Contribute a calibration area
roofclf, the per-building classifier that supplies most of the evidence atlas's Best
estimate (88% of it, currently), is only as good as the ground truth it is fit on: a
handful of small, hand-picked, exhaustively mapped neighbourhoods
("calibration quadrats") scattered across Pakistan.
Adding quadrats in landscapes the current set does not yet cover is the single most direct
way to make this project's numbers more defensible. No model change, no retraining
infrastructure, no GPU -- just OpenStreetMap mapping, done to one specific, strict rule.
This page is the fast path in. For the exhaustive rules (tagging conventions, imagery dating, QA, all six landscape strata), see the full mapping protocol; this page is the on-ramp to it.
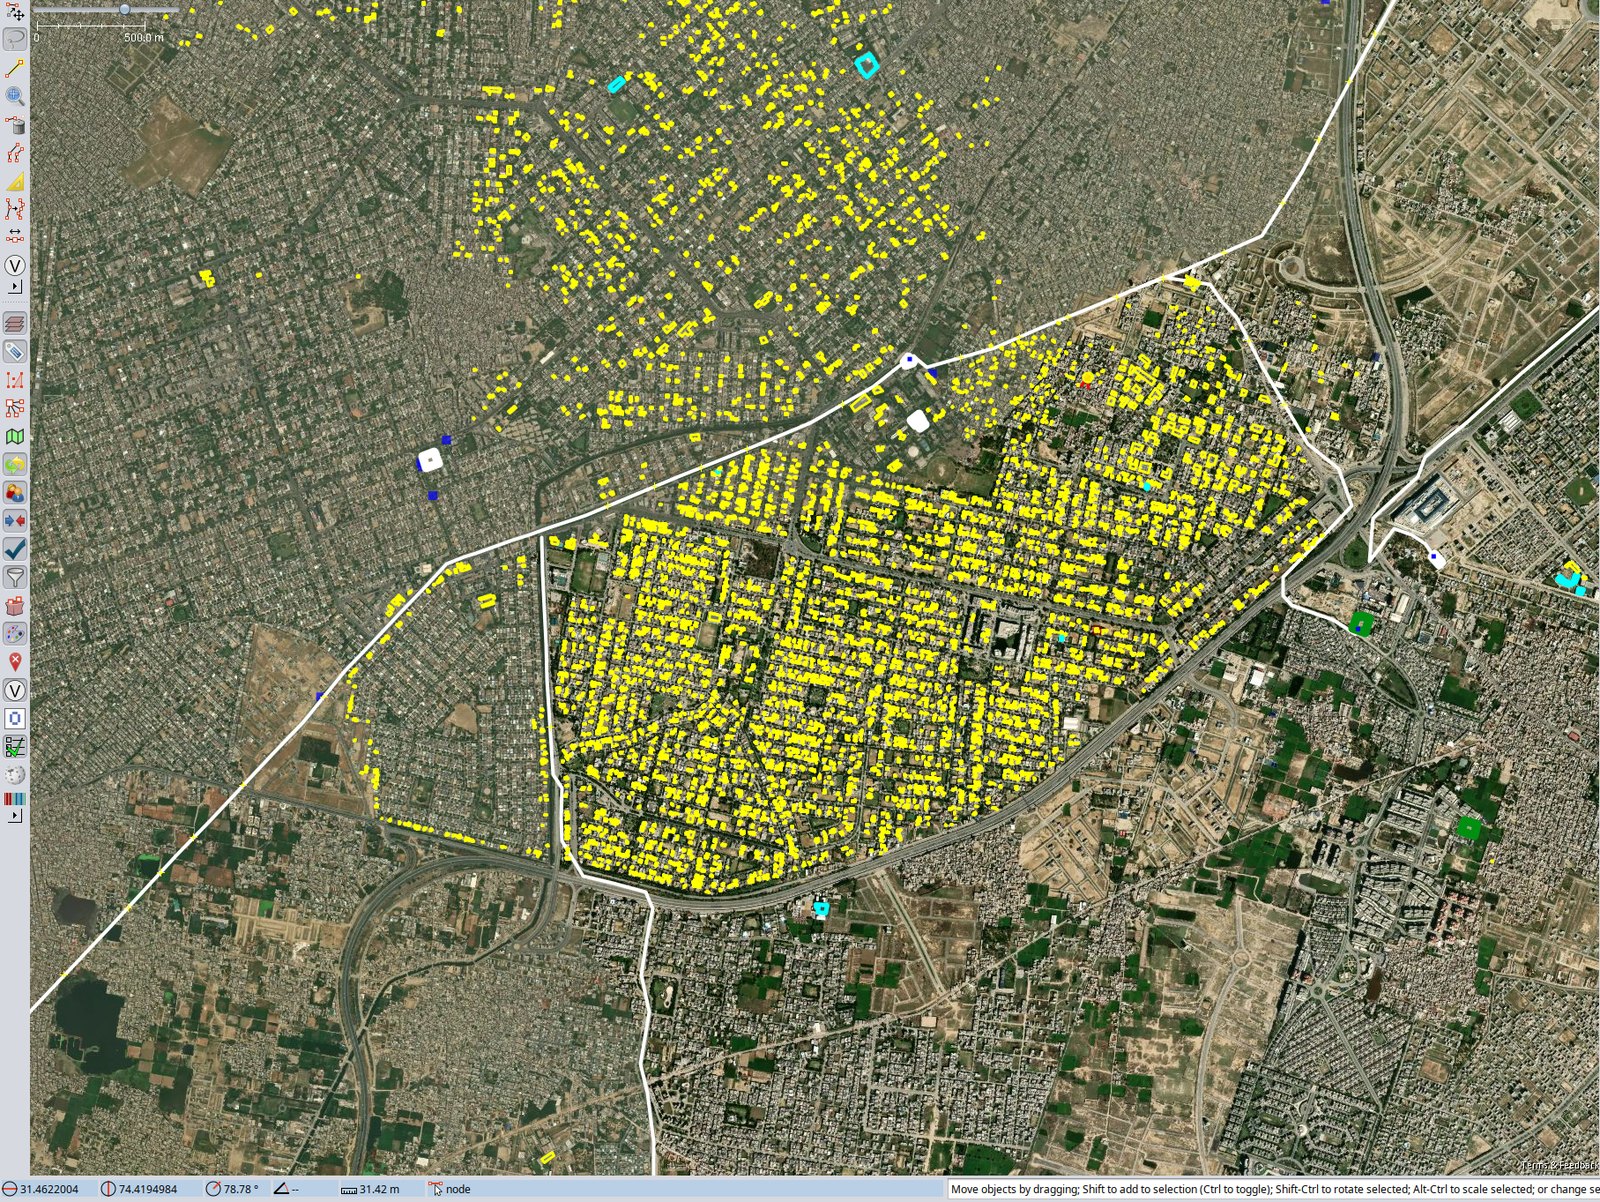
A finished calibration area in Lahore. Inside the boundary every visible panel is mapped; outside it nothing is, and the two look the same on imagery. That guarantee is the whole product here, and it stops exactly at the line.
Why this matters, concretely
A quadrat's own building density decides which national cells it can calibrate. As of
2026-08-20, the sparsest quadrat actually feeding roofclf's coverage-ratio/area-recall
correction sits at 124 buildings/km2 -- but 13.5% of the buildings that
correction is applied to nationally sit sparser than that (median around 89
buildings/km2). That gap used to be far worse: as measured 2026-08-16, the
sparsest supporting quadrat was 872 buildings/km2 and 84% of buildings sat below
it, pricing 54% of the whole published Best estimate with a correction fit on much denser
ground than it was applied to. See
Calibration density mismatch for the full
before/after.
One new, well-mapped quadrat in the right density range moves this measurably. That is what the candidates below are for.
Start here: eight ready-made candidates
Rather than pick a location from scratch, eight candidate squares are already screened by building density, spread across Punjab, Sindh, Khyber Pakhtunkhwa and Balochistan, and confirmed clear of every existing quadrat:
| candidate | province | district | source-grid density (bldg/km2) |
|---|---|---|---|
rajanpur_gap_calib_2km |
Punjab | Rajanpur | 54.4 |
kasur_gap_calib_2km |
Punjab | Kasur | 124.4 |
khairpur_gap_calib_2km |
Sindh | Khairpur | 55.3 |
jacobabad_gap_calib_2km |
Sindh | Jacobabad | 107.9 |
deraismailkhan_gap_calib_2km |
Khyber Pakhtunkhwa | Dera Ismail Khan | 63.2 |
haripur_gap_calib_2km |
Khyber Pakhtunkhwa | Haripur | 102.1 |
pishin_gap_calib_2km |
Balochistan | Pishin | 53.8 |
mastung_gap_calib_2km |
Balochistan | Mastung | 118.8 |
Files: data/labels/candidate_quadrats/<name>_candidate.geojson (one each) and
density_gap_candidates_combined.geojson (all eight in one layer). Full rationale for why
these eight, this density band, and these locations specifically:
Calibration boxes log, Box 19.
Read each candidate's own note property before doing anything else with it. Every one
says the same thing: this is a coarse regional screen, not a verified settlement. The
point (lat, lon) is the centroid of a ~100 km2 national grid cell whose
average density falls in the target gap -- it is not a promise that panels, or even a
proper settlement, sit at that exact point. Box 18's own three published quadrats moved
from source-grid densities of 549/250/150 buildings/km2 to actual, own-measured
densities of 895/237/146 once mapped -- expect something similar here. Picking your own
location instead of one of these eight is equally welcome, as long as it targets a
building density under about 125 buildings/km2 (the current gap) and is not
already inside an existing quadrat -- scripts/new_calibration_quadrat.py (below) checks
the second condition for you.
The five steps
1. Check the imagery, before anything else
There is no automated check for this anywhere in the pipeline -- it is a manual, visual step, and it is the single most common reason a candidate gets dropped. Three of Box 18's six original candidates (Mardan, Shikarpur, Sialkot District) never got mapped for exactly this reason.
Open the candidate box in JOSM (or Esri World Imagery Wayback, or Google Earth Pro's historical slider) and check:
- Is there high-resolution imagery at all over this box?
- How recent is it? PV in Pakistan is being installed fast; imagery more than about a year old will under-represent what is actually there today, and a quadrat mapped against it reads as "the model overcounts" when it is really just seeing newer panels. See Calibration imagery dating for why this specifically, not just general staleness, matters.
- Does the box actually sit on a real settlement, or does it need nudging? The candidate point is a coarse grid-cell centroid, not a surveyed location (see above).
If the imagery is too old or the box lands somewhere with nothing to map (open desert, empty of any built-up area), drop it and try another candidate, or pick your own location in the same density band. This is a legitimate, expected outcome, not a failure -- it is exactly what happened to half of Box 18's screen.
If the imagery looks good but the box needs to move onto the actual settlement, draw a better boundary in JOSM around it (File -> Save As -> GeoJSON) instead of using the candidate square as-is. Any closed shape works; it does not have to stay a square.
2. Preview it
python scripts/new_calibration_quadrat.py --dry-run \
    --name rajanpur_gap --lat 28.558966 --lon 69.790516 --side-m 2000
or, if you drew your own boundary in JOSM:
python scripts/new_calibration_quadrat.py --dry-run \
    --name rajanpur_gap --geojson ~/drawn/rajanpur_gap.geojson
--dry-run prints the geometry (area, bounding box, whether it fits inside one 2.24 km
training-chip window) and the overlap check against every existing quadrat, without
writing or fetching anything. Fix anything it flags before continuing -- most commonly an
unexpected overlap, which the next step refuses to proceed past without --allow-overlap.
3. Register it
Drop --dry-run to actually write the boundary and pull the current OpenStreetMap solar
features inside it:
python scripts/new_calibration_quadrat.py \
    --name rajanpur_gap --lat 28.558966 --lon 69.790516 --side-m 2000
This writes data/labels/rajanpur_gap_calib_2km_boundary.geojson (+ .parquet) and
rajanpur_gap_calib_2km_overpass_solar.parquet, and prints a ground-truth profile: size
distribution against the 400 m2 detection floor, rooftop/ground-mount split,
and roofclf.packing_density. A fresh box is never Rule-1 complete just because this
step ran. Registering the boundary and pulling whatever OSM already has is step zero, not
completeness -- see step 4.
4. Map every visible installation
This is the actual mapping work, and the one rule that overrides everything else:
Rule 1: completeness beats coverage. A quadrat is only usable once every visible panel inside it, as of the imagery you mapped against is in OpenStreetMap, down to the smallest rooftop unit. A half-mapped quadrat is worse than an unmapped one -- it silently teaches the calibration that the model overcounts. If you cannot finish it, say so; it gets excluded, no harm done.
Trace panel area only (never the whole roof), one polygon per contiguous panel group, tag
with power=generator / generator:source=solar / generator:method=photovoltaic /
location=roof (omit for ground-mounted). The
full protocol has the
complete tagging reference, what counts as PV (solar pumps, yes; water heaters, no), and
the common failure modes worth reading before you start (mapping only the obvious
installations, choosing a quadrat because it already looks solar-heavy, tracing roofs
instead of panels).
Never used JOSM? Do not learn it from this page. Open Energy Transition's
MapYourGrid campaign has the material already:
installing JOSM on Windows, macOS or
Linux, and the
JOSM Starter-Kit for configuring
presets, quality assurance, paint styles and the upload loop. It maps power lines rather
than panels, so the tagging does not transfer, but the editor skills are the same ones.
Its Strategies page is worth reading too: the todo
plugin, filters, fixme as inter-mapper communication and pre-upload validation all apply
here unchanged.
In JOSM, the loop is:
- File -> Open the
_boundary.geojsonthe previous step wrote. It comes in as its own layer. Never upload that layer -- the box is not an OpenStreetMap feature. Edit only in the OSM data layer. (Prefer to draw your own boundary instead of using a generated square? Draw it on a new layer (Ctrl+N) and save that layer with File -> Save As... -> GeoJSON Files, then pass it to the script with--geojson. See Drawing the boundary in JOSM.) - Download OSM data for the same area, then sweep the box systematically, block by block, rather than roaming.
- Flip between imagery layers as you go. A panel invisible on one background is often obvious on the next, because they differ in capture date, sun angle and resolution. Work through Bing, Esri World Imagery, Esri Clarity and Mapbox at minimum, and check the Imagery menu for a national or regional layer, which in many countries is sharper and more recent than any of them. This is the most common reason a "complete" box turns out not to be. See Flip between imagery layers.
- Validate (Ctrl+Shift+V), then upload to OpenStreetMap with a real changeset comment
and a
sourcetag naming the imagery you traced from. The panels belong in the map, not in a private file. See Uploading to OpenStreetMap.
A second mapper independently sweeping the same quadrat is part of the deliverable, not an optional extra -- it is what turns "I mapped everything" into a checked completeness declaration rather than one person's confidence.
5. Declare it and hand it off
Record, next to the boundary: mapper name(s), completion date, the imagery layer and its
best-known capture date, installation count, and how many the second pass added. This is
what turns a registered box into a Rule-1 quadrat ready to enter the next roofclf
refit -- roofclf.discover_quadrats picks up any boundary + mapped-solar pair
automatically, but nothing folds a quadrat into a fit without a human completeness
declaration first (see the
national workflow's random-cell validation note
for why this matters as much on the deployment side as on the mapping side).
Open a pull request, or hand the boundary + register row to whoever maintains this
project's data/labels/ -- the same place every quadrat in
the current set came from.
What happens next
Once a quadrat is Rule-1 and its density sits inside the target gap (or genuinely below
the current calibrated domain floor, currently 48.5 buildings/km2 -- a
different, harder thing to move safely: a quadrat only lowers that floor if its own
measured density is below it, not its surrounding region's average, and several attempts
at this have gone wrong in non-obvious ways -- see
Calibration quadrats before attempting
it), it is included in the next earthpv roof-classifier refit,
rescored nationally, and folded into the next evidence-atlas rebuild. The most recent
example of exactly this cycle -- three quadrats declared Rule-1, folded into a refit, and
moving the published headline number the same day -- is
Box 18.