Quality levels: Gold, Silver and Bronze
Every country atlas carries a calibration badge in its corner: Gold, Silver or Bronze. It says how far the atlas's figures have been checked, against installations mapped by hand and by people looking at what the model found, not how much solar a country has. The levels add up: Silver needs everything Bronze asks for, and Gold everything Silver asks for. A country shows the highest level whose every criterion it meets.
Bronze: every published atlas
| Criterion | What it means | Where it is set |
|---|---|---|
| Model trained on the country's own map | The segmentation model is fine-tuned on the country's own OpenStreetMap solar, and the shipped checkpoint is whichever of that local model and a general one finds more mapped installations in a held-out region chosen before training; a tie goes to the local model. Zambia, run before this rule, uses a general model. | scripts/pick_val_region.py, scripts/compare_local_vs_v5.py |
| Imagery over every populated cell | A dry-season Sentinel-2 composite over every 0.1° cell with at least 1,000 buildings, plus every cell holding mapped solar. Cells nobody imaged are hatched on the map, so bare land means imaged with nothing found. | earthpv compose |
| Hand-mapped solar counted once | Verified is OpenStreetMap's own solar, clipped to the border and dissolved so a plant outline and the panels mapped inside it count once. | scripts/prepare_national_osm_solar.py |
| Model outlines priced by measured precision | Best adds the model's outlines of about 400 m² and up, each weighted by the share of outlines of its size and placement that turned out to be real. Without a local recall reference this is a floor. | configs/calibration/<aoi>_candidate_precision.yaml |
| Very large outlines counted only once checked | An outline above 100,000 m² (10 ha) is a blob: 10 m pixels merge everything bright and touching into one shape, so it is as often a sheet of false alarms as a solar park the map does not have yet. A blob counts towards capacity only once it is mapped in OpenStreetMap or a person has judged it solar on the Sentinel-2 imagery the model saw; until then it is a lead in a file of its own. | density.load_oversize_admission, scripts/oversize_review.py |
| Plausibility gate | Before publication each region's ground-mount to rooftop ratio and its single-cell concentration are checked; a failure is looked at and stated on the page. | earthpv check-density |
| Mapping leads published | The model's outlines more than 100 m from any solar installation in OpenStreetMap, in two files: the leads, most promising first, and the very large outlines, largest first. Leads under 1,000 m² on ground steeper than 15° are left out (shaded slopes and cliff edges read like panels); larger ones on steep ground stay, marked steep_review, because a solar farm can stand on a mountainside, unless the ground is steeper than 30°, where a lead of any size is left out. France's audited lead release predates this rule. |
scripts/release_leads.py |
Silver: Bronze, plus local ground truth and leads mapped to localize the model
| Criterion | What it means | Where it is set |
|---|---|---|
| Local ground truth | The model's precision table is fitted against the country's own mapped installations as a recall reference, or the country has calibration areas in use where every visible panel is mapped (Rule 1). | atlas.derive_validation_score |
| Leads mapped to localize the model | The mapping flywheel has turned at least once: people have checked about a third of a lead file's leads, working down from the top, and a third of its very large outlines, largest first, mapping the real installations in OpenStreetMap and judging the rest not solar; and the localized segmentation model has been trained again on the country's OpenStreetMap solar, now holding that mapping. Until this is recorded the atlas shows Bronze, whatever its calibration earns. | validation.retrained_on_leads in configs/atlas/<aoi>.yaml |
Gold: Silver, plus installations below 400 m², checked by people
| Criterion | What it means | Where it is set |
|---|---|---|
| Installations below 400 m² calibrated | An estimate below the 400 m² floor, where 10 m pixels cannot outline an array: the rooftop classifier priced by a coverage ratio fitted on calibration areas mapped panel by panel, its interval from resampling those areas, or a legally complete national register. | roofclf, sub400_capacity.py |
| The small-installation estimate holds up | That estimate survives the check against its own ground truth: leaving each mapped area out in turn, or the register's municipal totals. | owner judgement, validation.score |
| The rooftop classifier checked by people | A person has checked the classifier's results on the national scoring behind the page, in two ways. Random validation: cells drawn at random from the whole country, away from the calibration areas, are reviewed on imagery and the real and false detections logged, because calibration areas are chosen on purpose and a classifier that does well there may not do well elsewhere. Point data inspection: the classifier's score for every building, exported as points, is looked through on a map for where it fires and where it stays silent. Until both are recorded the atlas shows Silver. | scripts/tile_roofclf_detections_geojson.py, results/roofclf_random_validation_log.csv, scripts/export_roofclf_points.py; owner judgement, validation.score |
When a lead counts as checked
A lead is checked when a person has looked at it on recent high-resolution imagery and either mapped the installation in OpenStreetMap or judged it not solar. Rooftop leads in towns and leads beside roads deserve the same look as the rest: dark asphalt junctions and shadows are the model's commonest false alarms. Leads marked steep_review need a look at the terrain as well. A very large outline is checked on the Sentinel-2 imagery the model saw as well as on recent high-resolution imagery, since a park built after the high-resolution capture shows only there; map the panels or the park's outline, not the blob. The lead mapping guide walks through a lead file in JOSM.
How much to map: a third
Mapping every lead does not pay: the real installations sit near the top of a lead file, which is sorted most promising first, and the bottom is mostly false alarms, above all among the small ones. Where people have worked through a lead file, the top third held more than two thirds of the leads they went on to map in Pakistan (385 of v3's 4,435 leads of July 2026) and nearly nine in ten in Yemen (246 of 2,259 in a week of October 2026); below it only 2 to 4% of leads were real. In Germany, whose register locates every installation of 30 kW or more, the top third holds 46% of the leads with a registered unit inside. So a third of the leads, worked from the top, and a third of the very large outlines, largest first, give the model most of what a full pass would. A maintainer records it as validation.retrained_on_leads, naming the lead file, the shares checked and the model trained on the result. It needs doing once: it does not lapse when a new lead file is made.
The levels follow the mapping flywheel
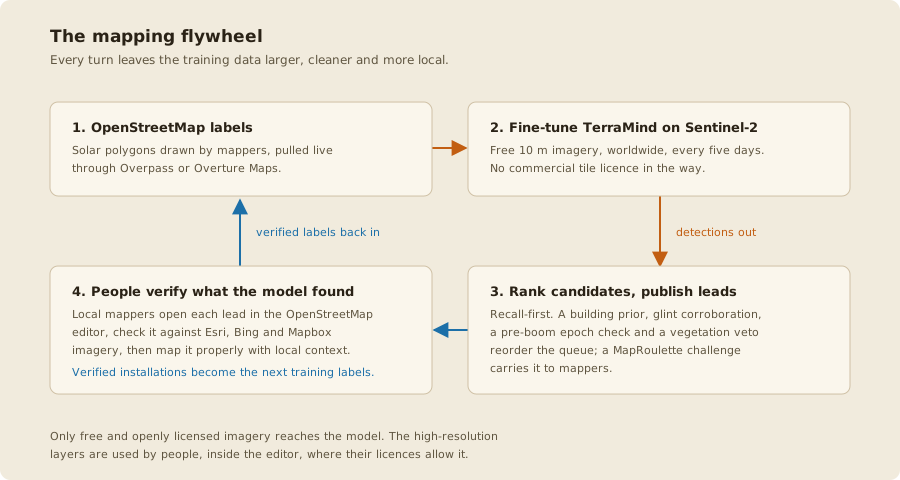
The levels say how far a country has come round the mapping flywheel, the loop in which the model and the people mapping solar in OpenStreetMap improve each other's work.
- Bronze: the wheel is set up. A model trained on the country's own OpenStreetMap solar detects arrays from space (station 1), and the atlas is published with its mapping leads and the areas to map (station 2).
- Silver: the wheel has turned once. People check a third of the leads and map the real installations (station 3), and the model is retrained on what they mapped (station 6), so its next leads come from a model that has learned the country's own false alarms and missed arrays. The figures are checked against local ground truth: mapped installations, complete calibration areas (station 4) or a register (station 5).
- Gold: the wheel reaches below the floor. Installations under 400 m² are too small for the model to outline, so no lead finds them. Calibration areas mapped panel by panel (station 4), or a legally complete register (station 5), are what the small-installation estimate is fitted on and checked against. People then check the rooftop classifier's results directly, on cells drawn at random and on its score for every building.
Each further turn adds labels the model learns from and areas the estimates are fitted on, so a country moves up by being mapped. The first turn counts for good.