Calibration quadrats: overview
This is the single current-state table for every ground-truth calibration quadrat --
what roofclf (earthpv roof-classifier) trains and evaluates on, and the only source
of real recall/precision evidence below the segmentation model's 400 m2 floor.
The narrative history of how each quadrat was mapped, re-pulled, and corrected over time
lives in Calibration boxes; this page is the
answer to "what do we have right now," regenerated from the label files directly
rather than hand-maintained prose.
Why two different things are both called "calibration" here
- This page -- hand-verified (or partially-verified) small areas where PV is mapped
from OpenStreetMap/Overpass, used to measure the sub-400 m2 detection gap and
train/evaluate
roofclf. See the mapping protocol for how a quadrat is built. - Candidate-precision calibration -- a different mechanism
(
configs/calibration/<aoi>_candidate_precision.yaml) that scores whether an already-detected candidate is real, at country scale. It reads some of these quadrats too (--calibration-box), but answers a different question.
Where they sit
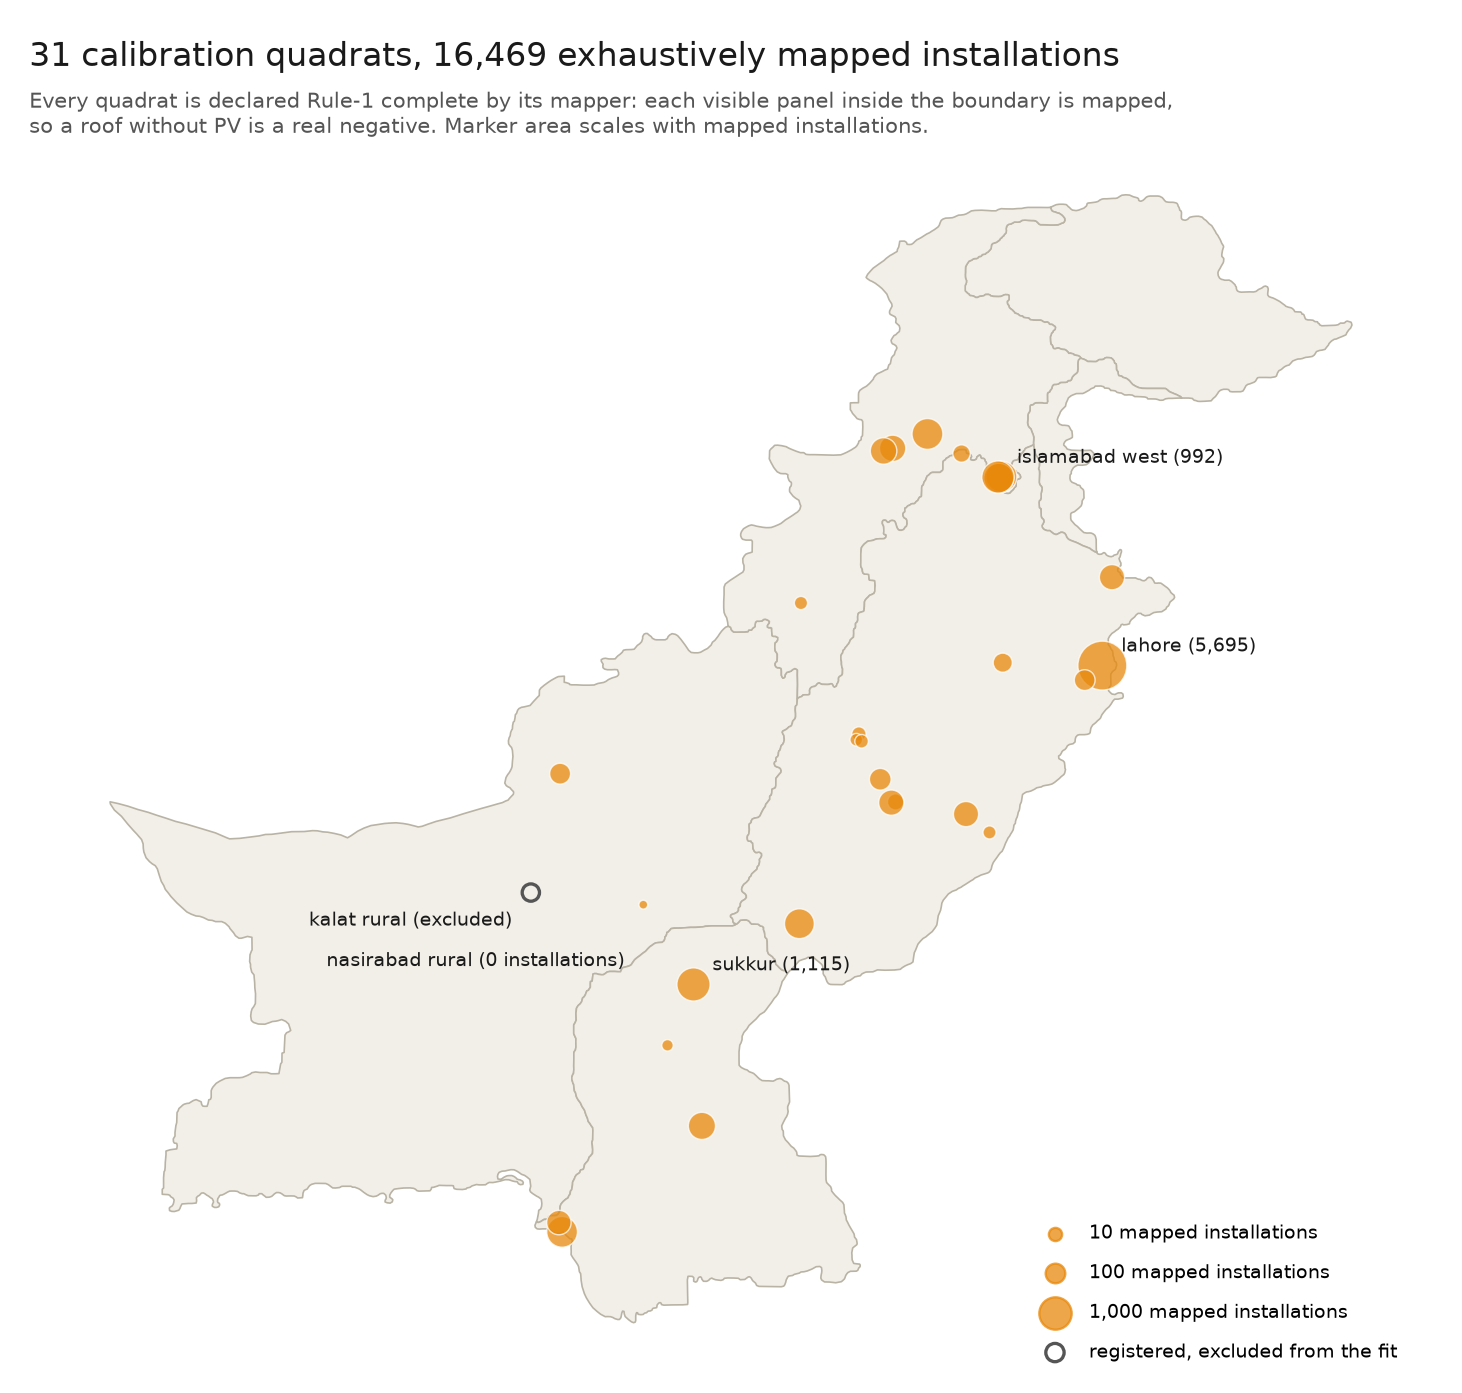
The map is generated straight from the label files on disk
(scripts/detection_domain_examples.py), so unlike the table below it always reflects
every registered quadrat -- currently 31, including Kalat Rural, which is registered and
Rule-1 but excluded from the roofclf fit (a ≥ 400 m2 ground-mount array
clipping roofs dominates its labels; see
Calibration boxes, Box 17). The geography is
the honest part: coverage is purposive and city-leaning, which is exactly why the
random-cell validation and the density-domain
restriction exist.
Current quadrats
31 quadrats are registered; 30 feed the current roofclf fit. Kalat Rural
(kalat_rural_calib_3km) is registered and Rule-1 but held out, because its mapped PV is
dominated by a ≥400 m2 ground-mount array that clips nearby roofs (22,064 of
its 28,412 m2 of mapped PV, against 18,919 m2 of roof area in the
whole box) and building_table's roof term has no placement/size guard yet to keep that
ground array from being counted as rooftop PV. roofclf.discover_quadrats globs the label
directory automatically, so it must be excluded by hand until that guard exists -- see
Calibration boxes's Box 17 for the measurement.
Geometry and mapped-PV columns come from data/labels/*_calib_*_boundary.geojson and each
quadrat's newest _overpass_solar pull; building columns come from a named roofclf run's
folds.csv via the VIDA join roofclf.building_table performs.
scripts/build_calibration_quadrats_csv.py regenerates results/calibration_quadrats.csv,
which is the authoritative source -- the table below is a snapshot of it and can lag behind
the newest quadrats until it is next regenerated. Sorted by base_rate (ascending) -- see
"What 'PV density' means here" below for what that column does and does not tell you.
rule1_complete is always a human mapper's declaration, never inferred from a boundary or
an OSM pull, however fresh.
Every quadrat's full mapping history -- how each boundary was drawn, re-pulled, corrected or replaced, and what each one moved -- lives in Calibration boxes.
| quadrat | province | stratum | Rule-1 | buildings | PV buildings | base rate | installations | median install m² | % sub-400 m² | packing (nn_median_m) |
|---|---|---|---|---|---|---|---|---|---|---|
| Khairpur Rural | Sindh | unclassified pending mapper review | yes | 564 | 3 | 0.5% | 3 | 22.1 | 100.0% | 11.7 m |
| Muzaffargarh Rural Wide | Punjab | unclassified pending mapper review | yes | 1,111 | 9 | 0.8% | 12 | 54.6 | 100.0% | 85.5 m |
| Muzaffargarh Rural | Punjab | unclassified pending mapper review | yes | 639 | 6 | 0.9% | 7 | 89.8 | 100.0% | 292.6 m |
| Quetta | Balochistan | 5 arid / bare-land settlement | yes | 5,258 | 157 | 3.0% | 73 | 103.9 | 94.5% | 44.0 m |
| Sialkot | Punjab | 2 dense older/informal urban | yes | 4,208 | 238 | 5.7% | 181 | 63.9 | 98.3% | 18.8 m |
| Malok | Punjab | unclassified pending mapper review | yes | 5,891 | 367 | 6.2% | 333 | 31.4 | 99.4% | 26.0 m |
| Multan | Punjab | 6 industrial | yes | 3,419 | 278 | 8.1% | 164 | 605.5 | 37.8% | 35.2 m |
| Sundar | Punjab | 6 industrial | yes | 2,401 | 217 | 9.0% | 132 | 1,047.5 | 29.5% | 47.0 m |
| Peshawar West | Khyber Pakhtunkhwa | unclassified pending mapper review | yes | 7,722 | 840 | 10.9% | 415 | 170.8 | 64.3% | 27.8 m |
| Rahim Yar Khan | Punjab | unclassified pending mapper review | yes | 5,554 | 691 | 12.4% | 664 | 28.0 | 98.6% | 17.3 m |
| Faisalabad | Punjab | 6 industrial | yes | 1,236 | 155 | 12.5% | 84 | 665.9 | 28.6% | 45.8 m |
| SITE Karachi | Sindh | 6 industrial | yes | 7,110 | 894 | 12.6% | 286 | 812.5 | 23.8% | 43.8 m |
| Mardan | Khyber Pakhtunkhwa | ⅓ planned housing, peri-urban | yes | 4,751 | 654 | 13.8% | 794 | 21.7 | 100.0% | 11.2 m |
| Sukkur | Sindh | unclassified pending mapper review | yes | 6,096 | 919 | 15.1% | 1,105 | 27.0 | 100.0% | 11.8 m |
| Islamabad S | Islamabad Capital Territory | unclassified pending mapper review | yes | 5,368 | 875 | 16.3% | 703 | 56.6 | 98.7% | 21.2 m |
| Peshawar | Khyber Pakhtunkhwa | ⅔ dense urban (unclassified) | yes | 2,111 | 348 | 16.5% | 360 | 71.5 | 99.4% | 15.7 m |
| Karachi coastal | Sindh | 1 affluent planned residential | yes | 4,584 | 813 | 17.7% | 794 | 82.7 | 98.9% | 18.5 m |
| Islamabad N | Islamabad Capital Territory | unclassified pending mapper review | yes | 3,736 | 793 | 21.2% | 708 | 92.1 | 97.5% | 22.7 m |
| Islamabad E | Islamabad Capital Territory | unclassified pending mapper review | yes | 5,270 | 1,130 | 21.4% | 829 | 77.6 | 96.4% | 20.4 m |
| Lahore (DHA 5) | Punjab | 1 affluent planned residential | yes | 13,500 | 3,432 | 25.4% | 5,688 | 29.0 | 99.0% | 6.8 m |
| Islamabad W | Islamabad Capital Territory | unclassified pending mapper review | yes | 3,815 | 999 | 26.2% | 992 | 75.8 | 99.0% | 18.0 m |
Rule-1 = yes means a human mapper declared every visible panel inside the boundary mapped, verified against high-res imagery, per the protocol's completeness rule. Only a Rule-1 quadrat's negatives (a building with no mapped PV) are trustworthy -- without the declaration, "not mapped" can mean "genuinely no PV" or "nobody has mapped it yet," and the two are indistinguishable. Every quadrat above now carries it (2026-08-05), so the column no longer discriminates between rows; it is kept because the distinction still governs what the negatives mean, and because a future quadrat starts out without it.
An eighteenth quadrat, islamabad_northeast_calib_3p34km2, was added 2026-08-06 from
a hand-drawn boundary (data/labels/calibration_boundaries/5-quad.geojson, the fifth
diamond in the same Islamabad cluster the four islamabad_{north,east,south,west}
quadrats above belong to) via scripts/new_calibration_quadrat.py. Confirmed clear
against all 17 existing quadrats (nearest is islamabad_east at 1.88 km). Not yet in the
table above -- that needs a build_calibration_quadrats_csv.py rerun against a roofclf
fit that includes it, which needs the VIDA building join, not just the raw OSM pull.
Measured directly from the pull in the meantime: 839 installations (99.0% sub-400 m²,
median 67.0 m², packing 18.6 m -- the same dense small-rooftop regime as the other three
Islamabad diamonds), 5,718 buildings, 1,292 with PV, base rate 22.6%. The owner declared
it Rule-1 complete the same day it was created -- recorded in
results/calibration_quadrats.csv (rule1_complete: True, since that column is a human
judgement no script may infer) -- so all eighteen quadrats now carry Rule-1, not
seventeen; the callout below predates this and still says seventeen.
A nineteenth quadrat, hasal_calib_1p00km2, was added 2026-08-10 from a hand-drawn
boundary (data/labels/calibration_boundaries/hasal.geojson, ~1 km² near Bahawalpur,
Punjab) via scripts/new_calibration_quadrat.py. Confirmed clear against all 18
existing quadrats (nearest is multan_calib_3p92km2 at 121.74 km). The OSM pull itself
succeeded on the first attempt (328 installations), but the script's independent
confirming cross-check against silent Overpass truncation could not complete -- all
three mirrors were down at the time -- so the pull is recorded pull_unverified: True
pending a re-check once Overpass recovers. Ground truth: 328 installations (99.7% below
the 400 m² floor, median 31.4 m², packing 18.5 m -- the tightly-packed
informal/residential regime). The owner declared it Rule-1 complete the same day it
was created, recorded in results/calibration_quadrats.csv.
Folded into a fresh 19-quadrat roofclf refit the same day: hasal contributes 4,378
buildings, 444 with PV (base_rate 10.1%), AUC 0.805. Its rate_ratio is
0.461 -- roofclf under-predicts adoption there by more than 2x, the same failure
shape as Rahim Yar Khan -- which keeps it just outside select_calibrated_quadrats's
[0.5, 2.0] band, so it does not (yet) enter the trusted-13 set the domain-restricted
sub-400 m² capacity fit uses. It does widen the pooled 19-quadrat LOQO fit behind the
national deployment threshold, which moved 0.2405 -> 0.2441 (median_fold_auc
0.8824 -> 0.8757). Not yet in the table below -- see
Calibration boxes's Box 13 for the full
writeup.
While registering the eighteenth quadrat, a real bug surfaced in
scripts/new_calibration_quadrat.py: the OSM-pull retry loop's except RuntimeError as e:
shadowed the e (east bound) local from w, s, e, n = poly.bounds earlier in main(),
and Python's implicit del e at the end of an except ... as e: block (PEP 3110) left e
unbound on any retry past the first failed attempt --
UnboundLocalError: cannot access local variable 'e' rather than a clean retry. Hit for
real this time because all three Overpass mirrors failed on the first attempt (504, 502,
connection timeout) before recovering. Fixed by renaming the exception variable to exc.
All seventeen quadrats are Rule-1 as of 2026-08-05
The repository owner declared completeness for the entire current set, which is what Rule-1 means here. Rule-1 coverage went from 3 of 12 to 17 of 17 in one step, and it is a reversal for Karachi coastal, whose Rule-1 the owner had withdrawn earlier the same day when its boundary was extended.
This is a large gain in what the quadrats can support. Precision, false-positive rate and
base_rate all require trustworthy negatives, and until now only three quadrats supplied
them -- an old-city bazaar, a planned housing scheme and an arid low-adoption city, none
of them in the dense small-rooftop regime the sub-400 m² program exists to measure. All
seventeen now do, including the coastal, capital-territory and Sukkur regimes that had no
Rule-1 coverage at all.
Two caveats to carry rather than forget, because nothing in the data expresses them. Five of the seventeen (Sukkur and the four Islamabad diamonds) were first pulled from OSM the same day they were declared complete, and no quadrat in this repo has a recorded independent second-mapper sweep -- that has been true since the first one and is not new. So a precision figure derived from these negatives is owner-attested rather than independently verified, which is a real standard of evidence but not the same one.
Rule-1 is relative to the mapping imagery, not to Sentinel-2
Mapping is done against OpenStreetMap's background imagery (Esri/Bing/Maxar), and its capture date does not match the Sentinel-2 composite the model reads -- it is generally older. So Rule-1 certifies "every panel visible in that imagery is mapped". It cannot certify panels built afterwards, and in Pakistan's boom that gap is precisely where new installations live: present in the model's input, absent from the labels. Rule-1 holds as of the mapping imagery, and only becomes a statement about the model's own epoch once imagery contemporaneous with the composite is acquired and swept.
The bias directions follow and are worth quoting alongside any number from these boxes:
| quantity | effect | why |
|---|---|---|
| precision | lower bound | a correct detection of unmapped-but-real PV scores as a false positive |
base_rate |
lower bound | a building carrying unmapped PV counts as a negative |
rate_ratio (pred/true) |
upper bound | it divides by that understated base_rate |
| recall over mapped installations | unaffected | it only ever divides by labels that exist |
The magnitude is measurable without new mapping, by running one checkpoint over two
imagery epochs (scripts/fraction_stale_label_audit.py): predicted PV now, not pre-boom,
and unlabelled is a candidate post-mapping installation rather than an error. Measured
2026-08-05 over 13 quadrats, it moves pooled precision 0.435 to 0.450 -- just 5.8% of
apparent false positives. But that pooled figure is dominated by industrial quadrats with
large false-positive pixel counts, and per quadrat it is the dominant error term exactly
where the sub-400 m² programme lives: 68.4% of apparent false positives in Karachi
coastal (precision 0.570 to 0.807), 23.7% in Quetta, 11.7% in Lahore.
imagery_layer and imagery_date in results/calibration_quadrats.csv are where the
epoch belongs. They are still empty for every quadrat, which is why the per-quadrat
magnitude is unknown rather than merely unstated -- see
Calibration quadrat imagery dating.
What "PV density" means here, precisely
Two different numbers on this page are both reasonably called "PV density," and they answer different questions:
base_rate(the column this table is sorted by) -- the fraction of buildings inside the quadrat that carry PV (pv_area / roof_area >= 5%). This is the numberroofclf's calibration work (see Capacity density) found does not transfer at a flat rate across quadrats -- Quetta (3.0%) and Lahore (25.4%) are an 8x spread, and a classifier's raw predicted rate does not reliably tell you which regime a new area is in. It is also a property of the specific boundary drawn, not of the place: extending a quadrat's boundary to cover more (typically less-dense) surrounding ground moves its ownbase_rate.- installation count / median size / % sub-400 m² -- describes the shape of the PV
population, independent of how many buildings there are. Peshawar and Mardan both have
99% of installations below the detection floor with small median sizes (71.5 m² and 21.7 m²) -- a genuinely different population from the industrial quadrats' few-but-large arrays (SITE Karachi: 70 installations, median 1,059.9 m²).
Neither number is "the" PV density of Pakistan -- each quadrat is a hand-picked landscape sample (see the protocol's stratum table), not a random one, and this page's own base-rate spread is the clearest evidence that pooling them into one national rate would be wrong. See The rooftop classifier for how (and how cautiously) this evidence feeds a capacity number.
Packing distance, at a glance
nn_median_m (median distance from a sub-400 m² installation to its nearest neighbour of
any size, roofclf.packing_density) spans a continuous range across the current quadrat
set, from tightly-packed informal/residential areas (roughly 7-19 m: Lahore, Mardan,
Peshawar, Karachi coastal, Sialkot) through intermediate (20-34 m: Rahim Yar Khan,
Peshawar West) to sparse industrial estates (44-52 m: Quetta, Faisalabad, SITE Karachi,
Multan, Sundar) and on to genuinely low-density rural quadrats, an order of magnitude
sparser still (Muzaffargarh Rural, 292.6 m). Packing distance tracks installation
clustering rather than building density as such -- Malok and Khairpur Rural, both
deliberately low-building-density quadrats, still pack tightly (26.0 m and 11.7 m)
because their few installations sit in a tight cluster rather than spread across the box.
This matters beyond bookkeeping: packing_density was adopted because it correlates
r=0.70–0.82 with the imagery instruments' per-quadrat scale and skill, and a bimodal
predictor invites treating the two modes as two regimes to calibrate separately. A filled
gap means the underlying variable is continuous, so the correlation -- not the
cluster label -- is the part to rely on. And that correlation is mostly installation
size rather than spacing as such: see
Capacity density
for the partial correlations that separate the two, and for why base_rate's even
stronger relationship with predicted-versus-true rate is arithmetic rather than
landscape.
Quetta is the one landscape-vs-packing mismatch: an arid settlement (not an industrial estate) that nonetheless packs sparsely -- a reminder that packing distance is a proxy for building layout, not a direct stand-in for the stratum table.
Adding a new quadrat
-
Run
scripts/new_calibration_quadrat.py, which does steps 1 and 2 together. Either give it a center and a side length, and it builds the box geodesically (pyproj.Geod.fwd, never drawn by eye):python scripts/new_calibration_quadrat.py \ --name peshawar_west --lat 33.9905887 --lon 71.4261494 --side-m 1500or hand it a boundary drawn in JOSM and exported as GeoJSON, which does not have to be square or even a single piece:
python scripts/new_calibration_quadrat.py \
    --name gujranwala_east --geojson ~/drawn/gujranwala_east.geojson
Either way it runs the overlap check before writing anything, pulls the Overpass snapshot and prints the size/placement/packing profile.
--dry-runstops after the checks. A drawn boundary additionally gets a geometry report (parts, vertices, holes, bounding-box span and fill, whether it fits one 2.24 km training chip), is named by its geodesic area rather than a side length (..._calib_1p24km2), and carriesshape: drawnplus the source path for provenance. The shape constraints that actually matter are in the protocol -- close the way, keep the bounding box under ~2.2 km. See the protocol for how to choose a good location (typical, not showcase; check this page for packing-distance/stratum gaps first). 2. Overlap with existing quadrats is checked before anything is written, and the script refuses to continue on a hit without--allow-overlap-- a box within ~1 km of an existing center will share a corner with it, which is fine for an adjacent neighbourhood but worth deciding on deliberately, not discovering after the fact -- see "Current quadrats" above for what an undetected overlap costs a fit. 3. It is discoverable automatically (roofclf.discover_quadrats, globs*_calib_*_boundary.geojson) as soon as the boundary + a matching_overpass_solarfile exist -- no registration step beyond that. 4. It is not Rule-1 until a human mapper completes and a second mapper countersigns the completeness pass (protocol link above). A boundary + OSM snapshot, however fresh or often re-pulled, is not a substitute -- see Peshawar's entry in Calibration boxes for what that looks like in practice (three re-pulls the same day as new labels landed, still not Rule-1). 5. For the completeness pass itself,pixi run calib-exportwrites every quadrat -- boxes plus already-mapped solar -- as one JOSM layer with a paint style, so every quadrat can be swept in one sitting instead of one boundary file at a time: Validating every quadrat in one pass.