Solar glint
src/earthpv/glint.py is the production module; postprocess --check-glint is the entry
point. For the physics, the country-wide pose survey and the sensitivity curve, see
Panel pose from glint. This page covers how the detector is
built and how it is budgeted.
The measurement
For each target, pull roughly two years of per-scene Sentinel-2 L2A statistics in bands
B03 and B08, plus the Scene Classification Layer for the cloud check below, scene cloud
cover at most 80 percent. The statistic per scene is the 98th percentile reflectance inside
the polygon against a 30 m annulus around it. Sub-pixel polygons fall back to an
all_touched mask so even a feature under 100 m2 reads its brightest touched
pixel. The third asset read costs roughly 50 percent more network time per scene than the
two reflectance bands alone.
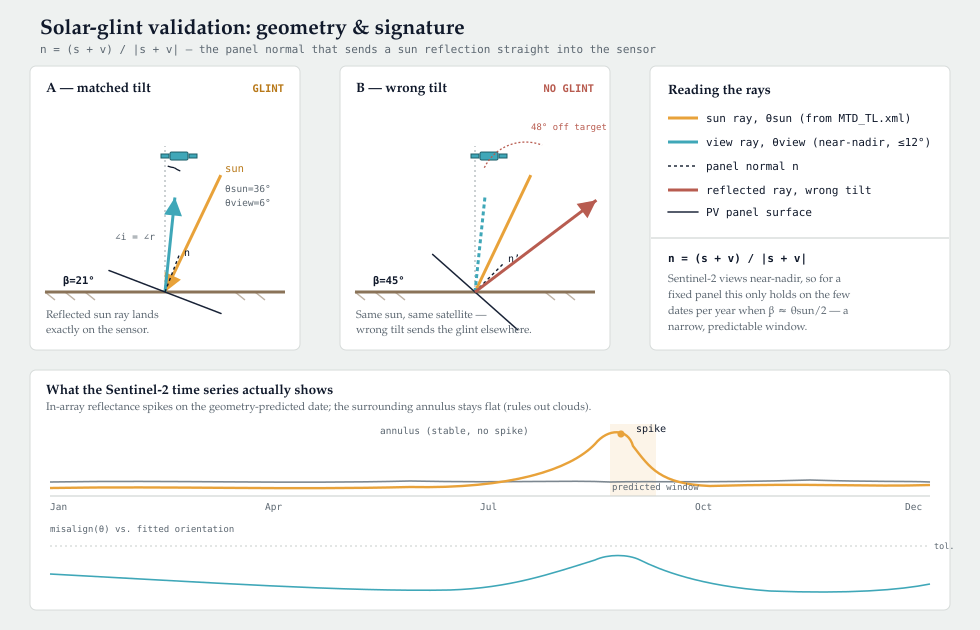
Detected means at least one spike: simultaneously bright in B03 and B08 inside the polygon while the surrounding annulus stays stable, which rules out haze and neighbourhood-wide cloud brightening.
Ruling out clouds
A bright cloud on a single date has the same shape as a glint: one scene far above the target's own baseline. Three filters separate them, and the third was added on 2026-08-11 after cloud false positives were reported from manual review.
Scene-level cloud cover. The STAC search drops scenes above 80 percent
eo:cloud_cover. This is a weak filter and is not doing most of the work: a scene reported
as 15 percent cloudy can still have a cloud sitting directly over one target, and measured
across 4,616 real scene rows the spike rate does not rise with scene cloudiness (4.4,
5.4, 5.5, 2.2 and 2.6 percent across the 0-10, 10-30, 30-50, 50-70 and 70-100 percent
bands). Whole-scene metadata is simply the wrong instrument for a per-target question.
The annulus. The 30 m ring around the target must stay dim, or stay near its own history in the self-referenced mode. This is what has been carrying the load, and it works because cloud brightens a neighbourhood while a glint is confined to one glass plane.
Per-pixel cloud flags, from the imagery itself. Sentinel-2 L2A ships a Scene
Classification Layer (SCL) alongside the reflectance bands, labelling every pixel:
classes 8 and 9 are cloud at medium and high probability, 10 is thin cirrus and 3 is cloud
shadow. SCL is native 20 m where B03 and B08 are 10 m, and the cloud fraction is computed
on SCL's own grid with no resampling, because the question here is the aggregate "was there
cloud over or around this target" rather than which individual 10 m pixel to mask. earthpv already used it to build the segmentation composites; the glint path did
not consult it until 2026-08-11 and now reads it per scene per target, recording
scl_cloud_frac (inside the polygon), scl_ring_cloud_frac (in the annulus) and
scl_npx. A scene with more than 20 percent cloud in the annulus is dropped from the spike
set and from the clear-sky baseline, since a cloud-brightened date would otherwise
inflate the baseline and hide real glints.
The gate is on the annulus, not on the target, and that is deliberate
SCL classifies bright saturated pixels as cloud, and a genuine specular glint often
is saturated. Gating on the target's own cloud flag would therefore throw away
exactly the events this detector exists to find. Cloud is spatially extended, so if
cloud is what brightened a target, its surroundings are almost certainly cloudy too;
the ring is the discriminator that a per-pixel flag can answer honestly.
scl_cloud_frac is still recorded so this confusion can be studied, but it vetoes
nothing.
A scene whose SCL cannot be read reports NaN and does not veto, so a series pulled before
this existed behaves exactly as it did. spike_fit returns n_cloud_vetoed next to
n_scenes: read a low spike count together with it, because a target under persistent
cloud loses scenes rather than being shown to have no PV. Below five surviving clear
scenes the code says so in a warning rather than reporting a confident zero.
Validated means one fixed panel orientation, a single tilt and azimuth, explains at least two spike dates through the specular reflection condition within a 3 degree tolerance. The spikes are then geometrically consistent with one glass plane rather than random brightening.
Sun and view geometry are propagated with Skyfield and cross-checked against the real
MTD_TL.xml granule angles. A separate check confirmed sun-only agreement is exact, while
full TLE-propagated forward prediction is unreliable for reconstructing historical spike
dates, which is why glint.py never uses TLEs for anything but the forward-looking
overpass calendar.
The contract with the ranking
Reward-only. A candidate with fewer than two mutually consistent spike dates is left unchanged, and the multiplier for a confirmed candidate approaches its size bucket's measured likelihood ratio, capped at four times, as the consistent-date count saturates at four. This matches the recall-first contract that the building and epoch priors follow.
Budgeting a network-bound check
Each candidate needs dozens to hundreds of Sentinel-2 reads, so the check is opt-in and targeted rather than universal.
- Candidates below 500 m2 are never queried. Their measured likelihood ratio is about 1, so the answer changes nothing.
- The
--glint-skip-tophighest-ranked candidates are skipped. They reach human validation regardless. - The
--glint-top-nbudget goes to the best-ranked eligible candidates in the uncertain band below that.
Fetched tile-major, not per candidate. glint.tile_scene_series_batch does one STAC
search and one set of asset opens per spatial bin (--glint-tile-deg, default 1.0 degree),
shared by every eligible candidate in it, instead of rediscovering the same scene list and
reopening the same cloud-optimized GeoTIFFs once per candidate. Candidates cluster heavily
by tile, so this measured a 22x speedup on a real six-candidate cluster, with output
identical to the old per-candidate fetch down to 0.000 numerical difference on matched
scenes. That equivalence was verified only after fixing a real bug in which a
seam-zone candidate could silently pick up an adjacent tile's non-covering item.
Each tile group tries Planetary Computer first and falls back to Earth Search on AWS Open Data, which needs no authentication and fails independently.
Token expiry at country scale
A country-scale batched run can silently lose roughly half the scenes for 48 percent of targets when the Planetary Computer signing token expires mid-run. Check the per-target scene counts before trusting a large pull, and relaunch: the per-target file resume design means nothing already fetched is lost.
Dense urban blocks need a different criterion
The default check requires the surrounding annulus to be dim right now
(a > 1.5 x r). At roughly 2,500 buildings per square kilometre that fails structurally:
every annulus is lined with similarly bright rooftops. Exhaustively scanning a 0.2 square
kilometre Lahore residential block against fresh Overpass ground truth found zero
detections anywhere, mapped or unmapped, and a confirmed heavily panelled 503 m2
rooftop never exceeded a 1.09 times ratio over a full year.
--glint-self-referenced (glint.annotate_spikes) swaps the absolute test for a temporal
one: the annulus must stay near its own baseline rather than be dim in absolute terms.
It keeps the same cloud and haze rejection, and it was verified to match the default mode
to within one consistent-date count on eight installations the default already detects. It
is a different criterion for the same evidence, not a laxer one. Reach for it in dense
urban contexts, not as a general replacement.
Glint as a direct detector
Tested, and mostly negative. Scanning every building rather than only model candidates gives about 1 percent hit rate on random buildings and about 9 percent on the model's new leads, from 61 validated targets. That is enough to produce a first glint-calibrated density contribution but not enough to replace the model.
The idea of using the population's dominant pose as a cheap forward model, predicting the few dates a standard panel would glint and checking only those across a whole city, is assessed and not recommended: the densest pose bin holds under 10 percent of fitted installations and the top five bins under 27 percent. Two narrower versions survive the data, per-locality pose calibration and a top-K triage pre-filter, and both are open work.
The point-spread function, and the false-spike floor (2026-08-17)
Sentinel-2's effective PSF at 10 m is now measured directly from glinting installations: sigma 0.65 px, 90% CI 0.60 to 0.70, fitted over 68 targets below 500 m² by forward- modelling each target's polygon at 1 m, blurring it and block-averaging onto each scene's own grid at its true sub-pixel position. ESA's stated MTF at Nyquist implies 0.49 to 0.62 px, and the small excess is covered by a measured per-scene source displacement of 0.72 px.
Matched filtering on that PSF is rejected: it loses to the p98-minus-annulus statistic already in use, because the glinting patch is not the whole array and moves between dates, so neither the shape nor the position a matched filter requires is known. The same study measured a fitted sigma rising from 0.65 to 2.20 px with installation area, which is the direct evidence for that.
The study's operational output is the false-spike rate on verified negatives: 2.0% (12 of 600 buildings inside Rule-1 complete quadrats carrying no mapped PV, over two years), against 8.7 to 20.3% previously measured on merely model-negative controls. Disabling the per-pixel SCL veto raises it to 4.5%, so that veto accounts for about half the improvement and unmapped real PV in the old controls for the rest. Against true detection rates the instrument separates by 14.9x at 100 to 500 m² and 7.9x below 100 m².
Opportunity: how many chances did this target actually get?
Measured 2026-08-12, and it changes a number already in the published calibration.
The capacity pipeline inverts the glint instrument to estimate what share of unmapped candidates are real: a size bin's sensitivity (the rate at which glint validates OSM-confirmed PV in that bin) divides the rate at which the same bin's unmapped candidates validate. That sensitivity was a per-bin constant, pooled across locations.
It should not be. The number of chances a target gets to glint varies enormously, for two
measured reasons: scene count (156 to 530 scenes in two years across the calibration
quadrats, depending on how many relative orbits cover the point) and pose compatibility (6.7
to 23.6 percent of a plausible installed population, per the section below). Multiplying
those gives an expected opportunity count E, which across the 499 study targets has a
mean of 6.0 and a range of 1.8 to 25.4.
Splitting each size bin into equal-count opportunity tertiles shows the effect directly:
| Size bin | low E |
mid E |
high E |
pooled constant |
|---|---|---|---|---|
| <100 m2 | 0.026 | 0.000 | 0.037 | 0.025 |
| 100-500 | 0.000 | 0.000 | 0.259 | 0.088 |
| 500-1k | 0.037 | 0.214 | 0.240 | 0.162 |
| 1k-5k | 0.241 | 0.357 | 0.321 | 0.306 |
| 5k-50k | 0.036 | 0.321 | 0.538 | 0.293 |
| >50k | 0.129 | 0.133 | 0.516 | 0.261 |
Sensitivity varies about 2x with opportunity inside a single size bin, which is the same
order as the variation between bins that the calibration already takes seriously. The
<100 m² row staying flat is the sanity check: a sub-pixel array does not glint however many
chances it gets.
earthpv.glint_opportunity replaces the constant with a one-parameter model:
E_i = sum over clear scenes of P(pose glints | pose prior)
k_i ~ Poisson(q_b * E_i),   validated = P(k_i >= 2)
q_b, the per-opportunity glint probability, is a property of the panels and the sensor
rather than of where a target sits, so it transfers between locations in a way a pooled
sensitivity does not. Fitted per bin it is monotone in size (0.056, 0.085, 0.088, 0.146,
0.169, 0.172), which is what the physics predicts: a larger array fills more of a 10 m pixel,
so its specular return survives mixing. Applied back to the study's own population the model
reproduces the study constants (0.306 against 0.293, 0.293 against 0.275), confirming it is
the same quantity at higher resolution rather than a different one.
capacity_calibration.derive_table now takes a sensitivity_override, and records both the
value used and the study constant it replaced, so an inverted precision can always be traced
back to which sensitivity produced it.
What this makes possible, and its one hard limit
Predicting sensitivity per target is what allows glint's absence to become evidence rather than merely no information. A target with 25 expected opportunities in the 5k-50k bin has a 92 percent chance of validating if it really is PV, so silence there means something; a target with 3 opportunities has a 9 percent chance, so silence means nothing. The limit is that reaching usable sensitivity requires both a large array and high opportunity, and most rooftops are neither.
Can a predicted glint date boost the roof classifier?
Tested 2026-08-11. No, and the reason is geometric rather than fixable by better processing.
The idea is a good one and worth writing down properly. roofclf reads a dry-season
median composite, and a median over roughly a dozen scenes is built to suppress exactly
the transient specular events that mark a panel. So one would expect that reading the few
dates when panels are geometrically able to glint should raise the signal-to-noise ratio,
most of all in a dense urban block where many installations would brighten at once.
Step 1: how many rooftops could ever glint
The glint condition is narrow. Sentinel-2 views near-nadir, so the pose that reflects sunlight into the sensor is roughly tilt = half the solar zenith, azimuth = the solar azimuth at the 10:30 overpass. Both are fixed by the calendar, which means each place has a band of observable poses, and a panel whose installed pose falls outside that band cannot glint into Sentinel-2 on any date, ever.
scripts/glint_observability_ceiling.py measures the band per calibration quadrat from real
granule sun and view angles, over two years, reading no pixels at all.
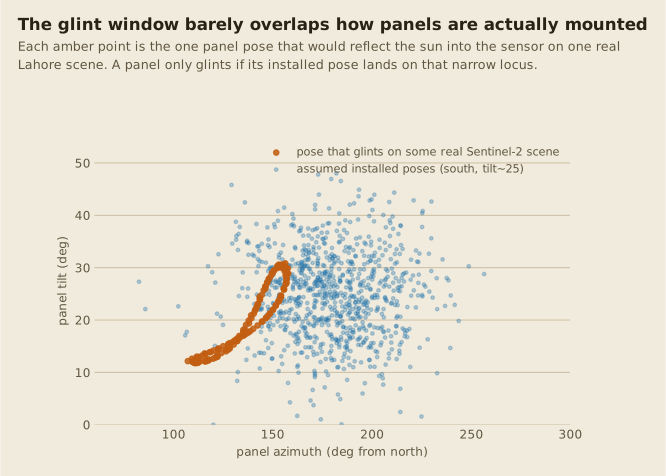
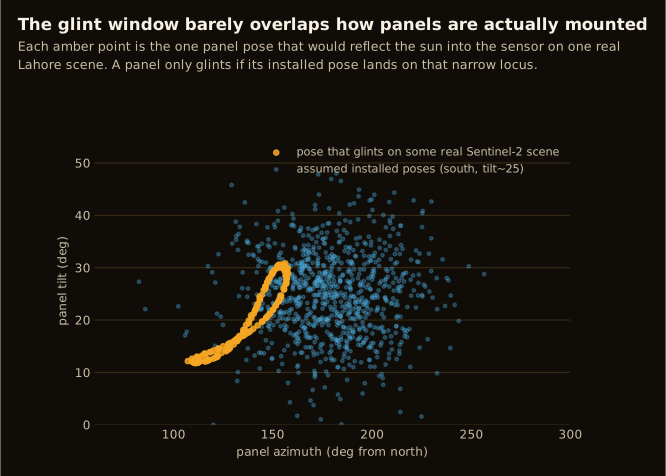
That picture is the whole finding. The amber locus is every pose that glints on some real scene; the blue cloud is where panels are actually mounted. A south-facing array at tilt 30 degrees, which is textbook practice at this latitude, has a minimum misalignment of 8.6 degrees across the entire two-year archive. It never glints. Tilt it to 20 degrees and it reaches 0.3 degrees, so it does.
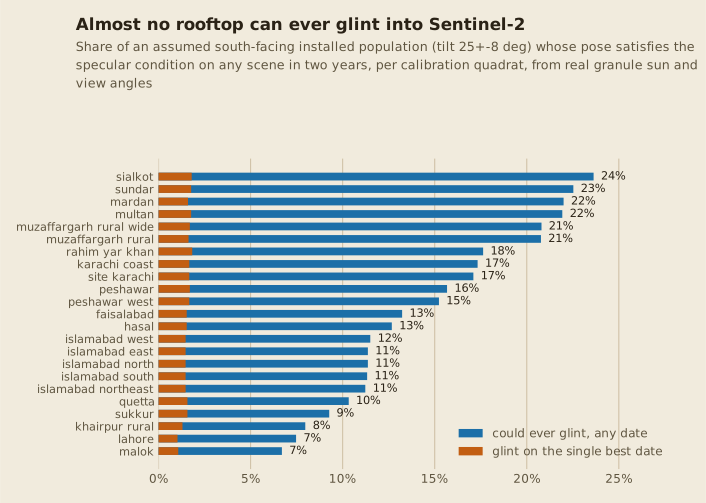
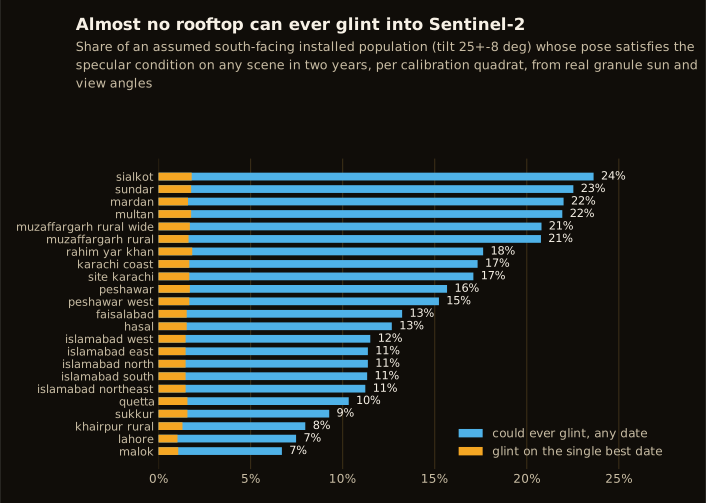
Across the 23 quadrats, the share of a plausible south-facing installed population that could ever glint has a median of 13.2 percent and a range of 6.7 to 23.6 percent. The single best date reaches only 1.0 to 1.8 percent. So the "one optimal date" framing fails specifically: even the union over two years of archive is a minority of rooftops, and any one date is a rounding error.
| Assumed installed pose | Share that could ever glint (median across quadrats) |
|---|---|
| Flat roofs, no frame (tilt 10 ± 6) | 10.1% |
| Shallow south (tilt 18 ± 7) | 14.3% |
| Textbook south (tilt 25 ± 8) | 13.2% |
| Steep south (tilt 30 ± 6) | 9.5% |
| Any orientation (azimuth 180 ± 70) | 7.6% |
The installed pose has to be assumed, and the pose survey cannot supply it
This project's 192-installation pose survey looks like the obvious input here, and it is not usable for it: those poses were fitted from observed glints, so every one of them satisfies the glint condition by construction. Measured directly, the survey's de-mirrored azimuths sit inside the observable band, which is what censoring predicts rather than what installer practice predicts. The table above therefore reports a grid of assumptions, and the spread between its rows is the real uncertainty. Note also that the survey stores each fit plus its mirror image (96 of 192 rows), because the specular condition at near-nadir view is degenerate in azimuth.
The variation between quadrats is not mainly latitude. It tracks how many relative orbits cover the point: Sialkot has 530 scenes in two years and a 24 percent ceiling, Lahore has 156 and a 7 percent ceiling. More overlapping orbits means more view azimuths, which widens the band. That is worth knowing because it is not improvable by processing either.
Step 2: what the feature is actually worth
scripts/glint_date_roofclf_feature.py takes the Lahore quadrat, the densest ground truth
in the project and exactly the dense-urban case the idea targets: 6.61 km2,
13,500 buildings, 3,432 of them carrying mapped PV. It pulls the top glint-window scenes,
takes the per-building maximum across them, and forms both a ratio and an excess against the
same building's composite brightness. Buildings are then split west and east, because
neighbours 20 m apart share pixels and roof material and a random fold would report the
optimism of memorising neighbourhoods.
Standalone, the feature does separate PV from non-PV: glint_ratio reaches 0.613 AUC,
better than plain composite brightness at 0.442. But within roof-size band it falls to
0.528, which says almost all of that separation was roof size, not glint.
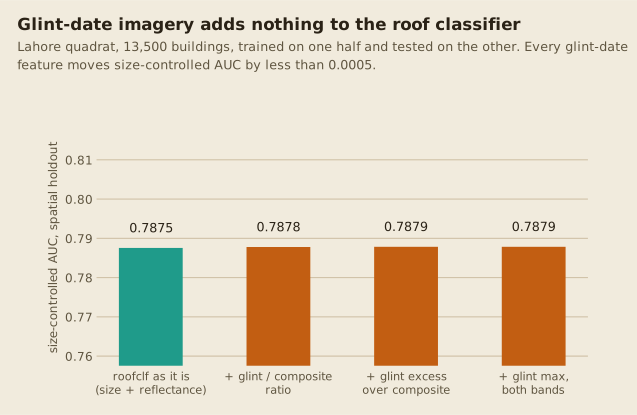
Added on top of the features roofclf already has, size-controlled AUC moves from
0.7875 to 0.7879, and plain AUC from 0.8925 to 0.8933. That is the same nothing that
epoch-jump and step-change
returned, and for the same underlying reason: at most a few percent of the buildings can
carry the signal at all, so the classifier has nothing to learn from.
What it looks like in the imagery
Numbers this small are easy to distrust, so here is the imagery underneath them. These are the five Lahore buildings where the hypothesis had its best chance: confirmed mapped PV, and the largest measured brightening between the composite and the glint window. Both rows share one colour stretch, and the baseline is the nearest clear scene five days earlier, so seasonal and atmospheric change cannot masquerade as an effect.
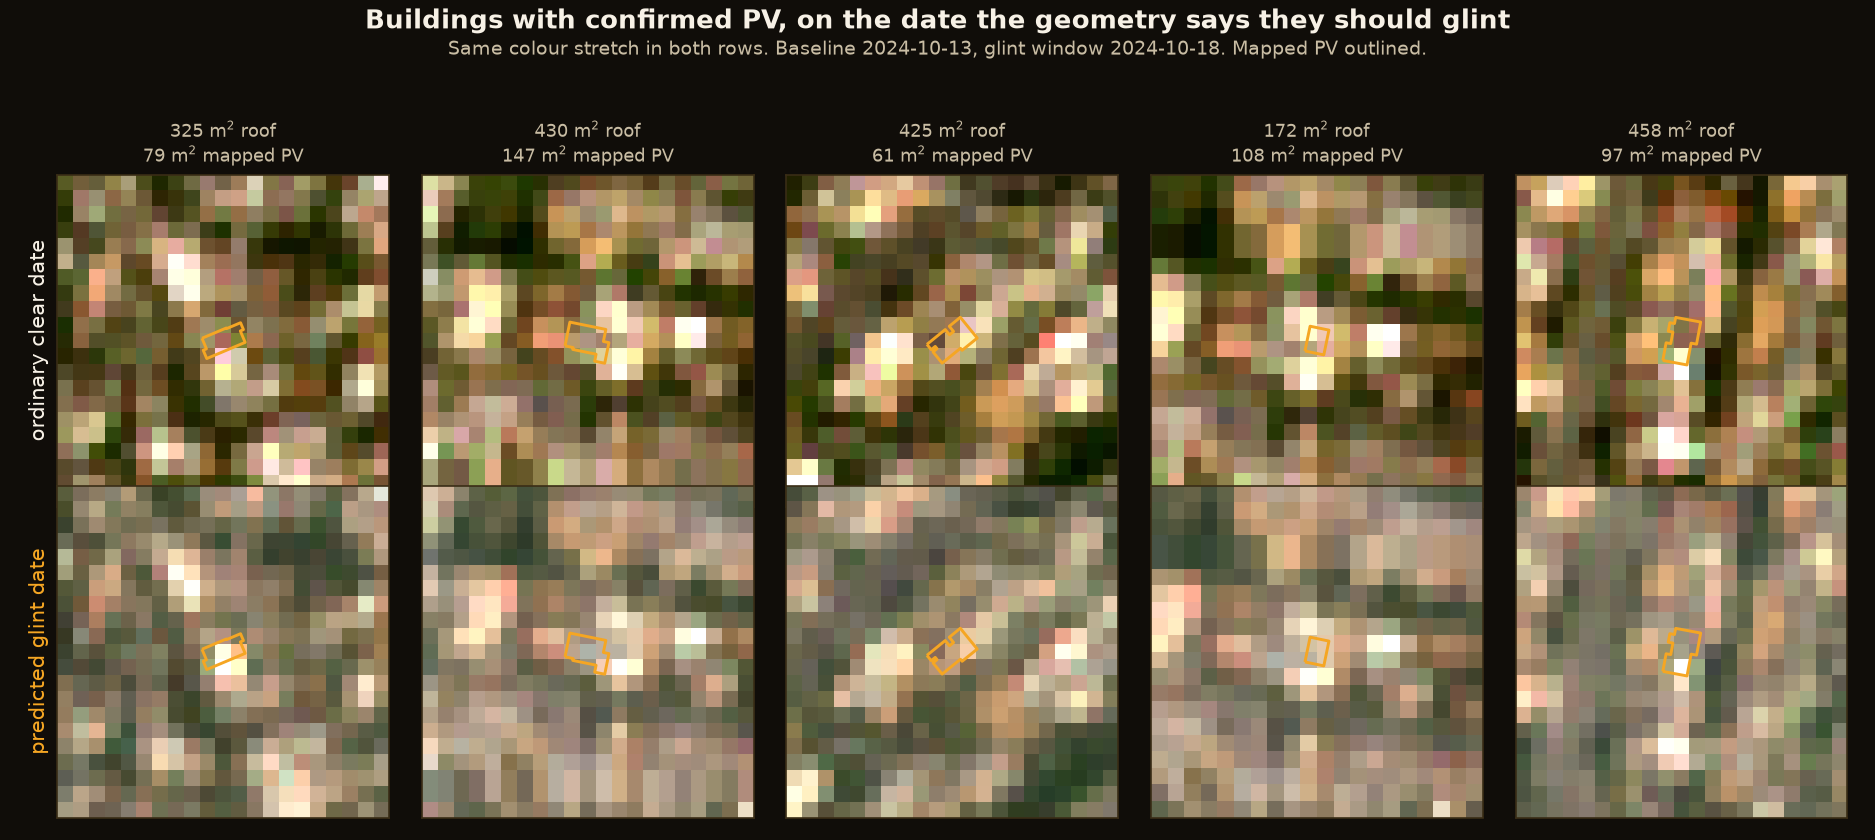
If the idea worked, the bottom row would show those outlined roofs flaring. It does not. Choosing the best cases rather than a random sample is deliberate, because a random sample could always be answered with "you did not pick the ones that glint".
What survives
The negative result is specific, not general, and two narrower versions are untouched by it. Per-locality pose calibration still makes sense: if a subdivision's installer used one pose, the glint dates for that pose are predictable, and the question becomes whether the locality's own pose happens to fall in the observable band rather than whether a national average does. And glint remains what it already was, a corroborating signal on individual large arrays, where detection reaches 73 percent above 50,000 m2. What does not work is using it to lift the small-rooftop classifier, because the physics puts the overwhelming majority of small rooftops permanently outside the observable band.
Detection rate, validation rate, and fitted pose all shift with latitude (2026-08-14)
The country2000 study (data/glint/country2000_summary.csv) was stratified by
installation size, not region, so it had never been cut geographically until
scripts/glint_pose_by_region.py did it directly against data already on disk -- no new
Overpass pull, no new Planetary Computer read. The motivation is physical, not
exploratory: Sentinel-2 crosses a given latitude at a fixed local time, so the specular-
reflection condition this whole page is built on is latitude-dependent in principle, and
Pakistan spans roughly 24-37N.
Three of six 2-degree latitude bands have enough targets to trust (n >= several hundred); the rest (26-28N, 28-30N, 34-37N, each under 40 targets) are noted but not read as signal. Within the well-sampled bands:
| lat band | n | detected % | validated % | median tilt | az range |
|---|---|---|---|---|---|
| 24-26N (coastal Sindh) | 435 | 39.5 | 21.1 | 9.7° | 81.7°-177.0° |
| 30-32N (central Punjab) | 959 | 29.6 | 13.6 | 14.6° | 105.6°-179.4° |
| 32-34N (upper Punjab) | 519 | 21.8 | 11.0 | 18.8° | 129.7°-180.1° |
Two things move together and cleanly, in the direction each has an independent reason to:
- Median fitted tilt rises with latitude (9.7° -> 14.6° -> 18.8°), tracking the standard solar-engineering convention that a fixed panel's optimal tilt increases with latitude. This is not a sensor artifact -- it is real installations plausibly mounted closer to their theoretical optimum, and it is a sanity check on the fitting method itself: if tilt did not track latitude this way, that would be the more worrying result.
- The fitted azimuth range's lower edge shifts with latitude (81.7° -> 105.6°
-> 129.7°, i.e. the observable wedge narrows and rotates further from due-east as
latitude increases), consistent with the fixed local-overpass-time geometry this page's
wedge derivation already depends on (see "Why the plot only fills part of the circle" on
the pose survey page). This has a direct consequence for
pose.py: the same wedge is currently applied nationally, computed from the pooled pan-Pakistan azimuth range, and this result says that pools together installations facing genuinely different observable ranges rather than one national truth. - Detection and validation rate both decline with latitude (39.5% -> 29.6% -> 21.8% detected; 21.1% -> 13.6% -> 11.0% validated). Read cautiously: this is consistent with the wedge narrowing at higher latitude (fewer installations fall inside an observable range at all), but installation type, mounting convention, and building stock also differ by region and are not controlled for here -- the province cut below shows exactly this kind of confound.
Province cut surfaces at least one difference latitude alone does not explain. Islamabad Capital Territory (n=300, at a latitude similar to upper Punjab) validates at only 4.7%, well below Punjab's and Sindh's pooled rates -- not predicted by the latitude trend above, and more likely a real difference in ICT's building stock/mounting convention (planned-housing developments, different roof geometry) than a sensor effect.
Not recommended from this: a full national exhaustive glint pass. Direct per-target
checking costs ~1 min/target, so scoring every building nationally (tens of millions) the
way roofclf-score-national does is not viable for this instrument, and was never the
proposal.
A targeted random top-up, and an atlas page (2026-08-14)
The thin bands/provinces above (26-28N, 28-30N, 34-37N; Khyber Pakhtunkhwa,
Balochistan, Gilgit-Baltistan, Azad Kashmir) got a follow-up: scripts/glint_orientation_
region_topup.py drew 401 more targets at random from the same source
(data/labels/pakistan_overpass_solar.parquet), restricted to exactly those strata and
excluding every osm_id country2000 already pulled, then ran the same tile-batched fetch
(150-target chunks, same date range) so the two pulls are directly poolable. All 401
completed with healthy scene counts (chunk medians 293-380, no zero-scene targets).
Merged into data/glint/pakistan_combined_summary.csv (2,401 targets total).
The well-sampled bands replicate closely (24-26N: 435->490 targets, 39.5%->36.7% detected; 30-32N: 959->982, 29.6%->29.1%; 32-34N: 519->605, 21.8%->20.8% -- tilt and azimuth trends unchanged), which is reassuring: the top-up did not need to touch these, and it did not disturb them.
The top-up genuinely moved the thin groups, and not always the way a hopeful redraw would. Khyber Pakhtunkhwa grew from 53 to 253 targets, but its validation rate fell from 11.3% to 7.5% -- the original small sample was optimistic by chance. Balochistan (34 -> 114 targets) fell similarly, 26.5% -> 16.7%. Both are now bigger, more trustworthy rate estimates, but neither has enough fitted (pose-worthy) targets yet to report tilt/azimuth (Balochistan: 19 fitted; Khyber Pakhtunkhwa: 19; the reliability threshold is 20). Azad Kashmir (8 installations nationally) and Gilgit-Baltistan (2) remain a full census, not a sample -- there is nothing left to draw.
A night-lights-style atlas page (scripts/build_glint_pose_regional_atlas.py ->
results/pakistan_glint_pose_regional.html) plots every one of the 2,401 targets on a
province choropleth (validation rate, dashed outline where too thin to trust) alongside
the latitude-band bars, matching this project's other interactive result pages.
Research scripts
| Script | What it answers |
|---|---|
glint_observability_ceiling.py |
per-quadrat ceiling on how many rooftops could ever glint, and the optimal date |
glint_date_roofclf_feature.py |
whether glint-date imagery adds anything to roofclf (measured: no) |
glint_date_gallery.py |
the before/after imagery behind that result |
glint_validation.py, glint_validate_pakistan.py |
the core empirical validation, the latter at country scale stratified by size |
glint_candidate_precision.py |
stratified glint sample of unmapped candidates, feeding calibrate-candidates |
glint_iou_experiment.py, glint_pixel_refine.py |
can glint move pixel IoU rather than just re-rank? Threshold gating no; per-pixel spike-amplitude trim, a narrow win |
glint_density_*.py, glint_cell_density_*.py |
two attempts at regional density from glint, both negative |
glint_pose_by_region.py |
re-cuts a glint study by latitude band and province -- detection/validation rate and fitted tilt/azimuth all shift with latitude |
glint_orientation_region_topup.py |
targeted random top-up of the thin latitude bands/provinces glint_pose_by_region.py found, poolable with country2000 |
build_glint_pose_regional_atlas.py |
night-lights-style atlas page for the regional re-cut -- province choropleth + per-target points + latitude-band bars |
glint_psf_photometry.py |
measures the effective PSF by forward-modelling each footprint, then tests matched filtering against the aperture statistic (measured: worse) |
glint_psf_negatives.py |
draws and pulls the Rule-1-verified negative control set behind the 2.0% false-spike rate |
glint_skyfield_check.py |
independent astronomy cross-check of the geometry fit |
s1_corner_reflector_test.py |
the Sentinel-1 dihedral hypothesis, negative |
glint_s2_example_grid.py |
builds the Sentinel-2 image gallery |
build_pv_pose_country2000.py |
builds the pose survey page |