How roofclf sees panels
roofclf finds rooftop solar by looking for roofs that are darker than they should be, most
of all in near-infrared light. Solar modules are built to absorb sunlight while ordinary roofs
reflect much of it, and the gap between the two is widest in the near infrared. This page
explains that physics, what a 10 m pixel makes of it, and where it runs out. The model itself
is described on the roofclf page.
Why panels are dark in the near infrared
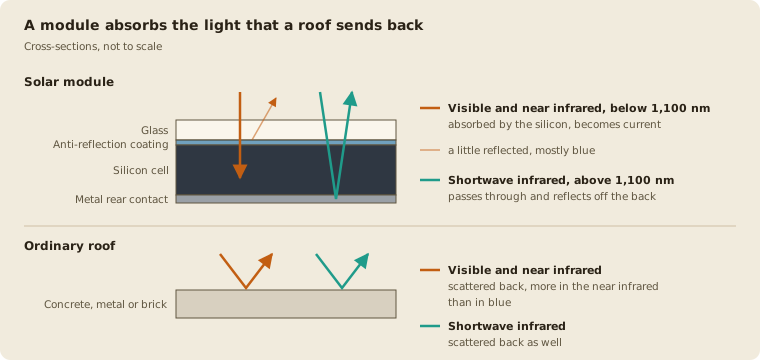
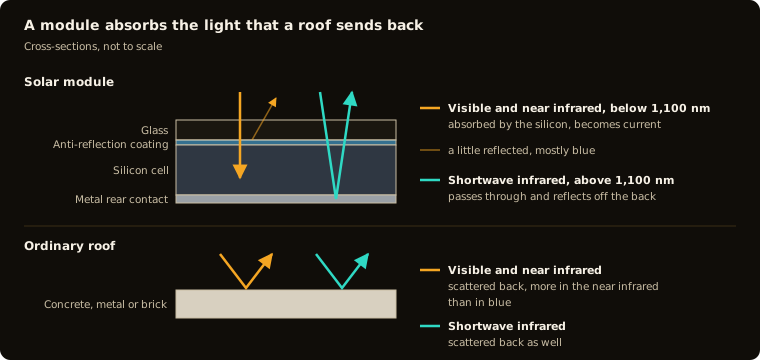
A silicon cell absorbs any photon with more energy than its band gap of 1.12 eV (PVEducation), which is all light shorter than about 1,100 nm: the whole visible range and the near infrared. A module is designed to keep that light, because every reflected photon is lost power. Three parts work together:
- The silicon. Blue light is absorbed within a few microns of the surface. Red and near-infrared photons sit closer to the band gap and travel hundreds of microns first (PVEducation). Cells are thick enough, and trap light well enough, to absorb most of them anyway.
- The anti-reflection coating and textured surface. Bare silicon reflects over 30% of incoming light. A coating a quarter of a wavelength thick, tuned to 600 nm near the peak of sunlight, cancels most of that (PVEducation). What it does not cancel is mostly blue, which is why cells look dark blue.
- Glass and encapsulant. Both are clear across the visible and near infrared, so the light reaches the cells.
Ordinary roofs do the opposite. Concrete, cement sheet, brick and metal scatter more near-infrared light than blue: on the median PV-free roof in the Pakistani calibration quadrats, reflectance rises from 0.21 in blue (B02) to 0.31 in the near infrared (B08). The gap between roof and panel is therefore widest exactly where panels absorb hardest.
Beyond about 1,100 nm silicon becomes transparent. Shortwave-infrared light passes through the cell, reflects off the metal contact at the back and comes out again, so the module brightens and the gap narrows. At 2,190 nm (B12) the gap opens again. The most likely cause is absorption in the plastic layers, the encapsulant and backsheet, which airborne PV mapping already exploits (Ji et al. 2021).
What Sentinel-2 measures
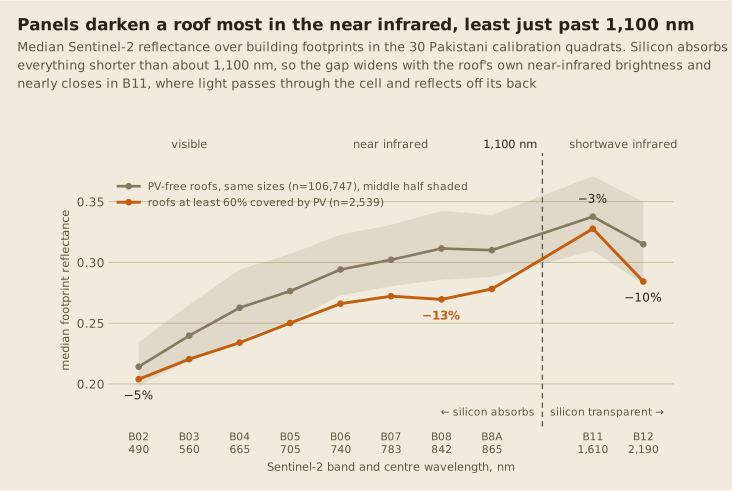
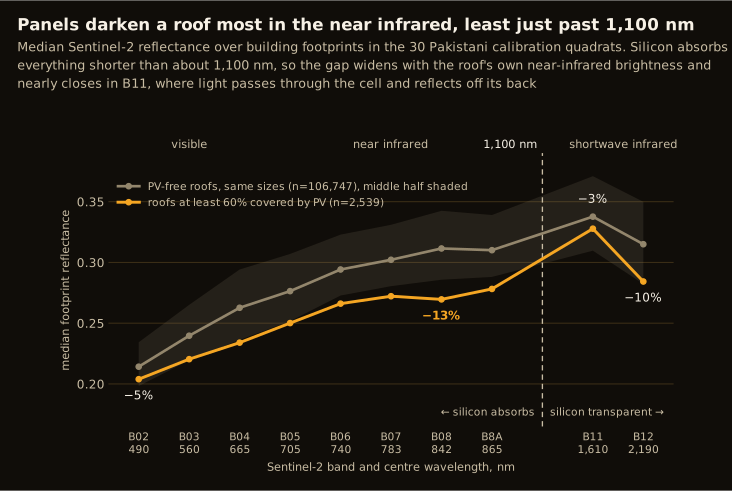
Both kinds of roof brighten from blue towards the infrared, but roofs mostly covered by panels fall furthest behind in B08, by 13%. Past the band edge the gap shrinks to 3% in B11, then reopens in B12. B08 is also one of the four bands Sentinel-2 records at 10 m; the 20 m bands either side of it average in more of the surroundings, which is most likely why they separate less. The chart compares roofs at least 60% covered, to show the physics clearly. Over every PV roof, most of them far less covered, the gap is shallower (8% in B08), as the roofclf page's spectral comparison shows.
What a 10 m pixel sees
A Sentinel-2 pixel covers 100 m2, and the median array covers about a quarter (26%) of its building's footprint. The pixel therefore records a blend of panel and roof, weighted by that fill fraction f:
The measured data follow this closely. In B08 a footprint reads 0.314 with no panels and falls in a straight line with f, to 0.252 at full cover. At the median cover the darkening is 0.016, less than half of the 0.042 by which PV-free roofs already differ from each other. The full-cover value is still far brighter than a bare module, because even a fully covered footprint is averaged with its own edges, walls, shadows and neighbouring pixels.
From pixels to a probability
roofclf is a logistic regression on 17 numbers per building, fitted on 30 hand-mapped
calibration quadrats (123,898 buildings, 17,151 of them with PV):
- Footprint. Each outline comes from VIDA Open Buildings.
- Roof spectrum. Each of the ten bands is averaged over the footprint, every pixel weighted by the share of it the roof covers. The weighting matters: 72% of footprints contain no pixel centre at all.
- Spectral shape. Five ratios are added: NDVI, NDBI, brightness, SWIR-to-visible and blue-to-red. A ratio cancels overall brightness, so it asks whether a roof is dark in the near infrared compared with its own visible bands, rather than whether it is dark.
- Size. Roof area and footprint confidence are added, because larger houses carry PV more often.
- Probability. The fitted weights turn the 17 numbers into a probability that the roof carries PV.
In a typical quadrat left out of the fit, it ranks a random PV roof above a random PV-free roof 87% of the time, and 82% of the time between roofs of the same size. The ten bands are strongly correlated (up to 0.98), so single weights trade off against each other and should be read as a whole. SPPI, a fixed five-band formula built on the same spectral shape, is the cross-check that needs no training.
Limits set by physics
The weak point is not the sensor but the roofs, and no processing removes it.
- The noise is the roofs. PV-free roofs differ by 0.042 in B08, against Sentinel-2's own noise of about 0.001 to 0.002. More scenes, better atmospheric correction and denoising all address a term 20 to 40 times smaller (the SNR budget).
- The ceiling is the fill fraction. The signal is f times the panel-roof contrast, and f
is set by array size against pixel size. The median French array is about a fifth of a
pixel, and
roofclfscores 0.71 AUC there against 0.86 in Pakistan (where the spectral detector stops working). - Comparing a roof with its neighbours does not help. Subtracting the median of nearby PV-free roofs cuts roof-to-roof noise by 42%. It also removes the part of the signal that comes from which neighbourhoods adopt PV, and the classifier comes out no better (same register entry).
- It is statistical, not a per-roof verdict. Plenty of PV-free roofs are darker than the
median PV roof.
roofclf's probabilities are summed over thousands of roofs into an adoption rate, which is where they are reliable.
The chart's numbers are written by scripts/roofclf_covered_spectra.py to
results/roofclf_covered_roof_spectra.csv from the production building table.