Germany: capacity map and register validation
Germany is the only place this project can check itself against an answer rather than against another estimate. Registration in the Marktstammdatenregister (MaStR) is legally mandatory for grid-connected PV, so German rooftop capacity per municipality is not a sample. This page is the first national end-to-end run there, produced 2026-08-31 from compose through the atlas below and re-derived twice since, because the register found two errors in it.
It is a different kind of page from the Pakistan capacity map or the Gujarat map. Those report what the pipeline estimates. This one reports how wrong that estimate is, because here that is measurable.
This atlas's tier totals fail a register check. Do not quote them.
The evidence atlas reports Verified 26,635 MWp and Best 88,709 MWp for Germany (2026-09-15, on the no-filter grid and a border-clipped OpenStreetMap pull). The tiers rest on converting mapped polygon area at a constant, and unlike anywhere else this project works, that assumption can be checked against a complete register rather than merely suspected — see the reconciliation below.
Verified is the hand-mapped OpenStreetMap population, converted at the module constant for rooftop and the land constant for ground. Against the register:
| OSM-derived | MaStR registered | ||
|---|---|---|---|
| Rooftop | 22,032 MWp (122.4 km² × 0.18) | 74,823 MWp | 29.4% of all capacity, from a reference covering 3.6% of units |
| Ground | 43,965 MWp (879.3 km² × 0.05) | 37,138 MWp | 118% |
The ground component alone exceeds all registered German ground-mount capacity,
which is impossible. The cause is mapper convention, and it is already measured further
down this page: nothing in OSM records whether a generator:source=solar polygon
outlines the panel array or the whole roof or site it sits on, and Germany's implied
kWp/m² spans 0.02 to 0.99 against the project's 0.18. Area × a constant does
not give German capacity.
Germany's defensible number is the segmentation estimator est_mwp_rc_roof, at an OLS
slope of 0.405 against the register. The atlas is published for its structure and
per-cell geography, not for its headline figures.
Segmentation-only: no roofclf half, and a register cannot supply one
Germany has zero calibration quadrats, so neither roofclf nor the sub-400 m2
instruments exist for it, the same state as Gujarat. Verified therefore has no
roofclf-AND-SPPI population to add and Best no roofclf-alone density; both tiers stop at
the 400 m² floor, above which sits only 34.5% of German rooftop capacity. The
register does not substitute: MaStR publishes no coordinates below 30 kWp, which is
roofclf's entire domain. Closing this needs mapped German quadrats, and the 3.6% OSM
completeness measured below means they have to be mapped, not derived from an OSM pull.
The six-exposure page previously published here was deprecated and removed
(2026-09-02). density used to build it automatically alongside the real product, and
its hero figure read 114 GWp.
What ran
| 4,656 | 0.1° cells composited and inferred (of 4,664 selected; 8 returned empty composites from both STAC sources) |
| 2025-04-01 to 2025-09-30 | composite window, matched to the register cutoff and to the training imagery |
v4_combined_all epoch=41 |
checkpoint. Not the documented v3_combined_india, which is no longer on disk (owner-approved substitution, 2026-08-23) |
| 23,920 | capacity-relevant candidates (of 24,590; oversize blobs excluded as density does) |
| 6,613 / 17,307 | OSM-mapped / unmapped candidates |
| 10,533 of 10,949 | municipalities covered: 96.2% by count, 99.75% by capacity |
That coverage is what lets validate_density_against_mastr report a national result instead
of refusing. The guard is not decorative: a run covering 4 of Germany's 76 MGRS tiles would
have produced a national sum near 5% of truth and a slope that reads as catastrophic model
failure rather than as missing imagery.
How accurate is it
Truth here is kw_rooftop - kw_le_72 = 25,723.5 MWp, the registered capacity in units
above the 400 m² / 72 kWp segmentation floor. That is the denominator a ≥ 400 m²
model can actually see; measured against all rooftop capacity (74,637.6 MWp) every slope
below falls by roughly the 65.5% sub-floor share, which is a statement about the floor and
not about the model.
| Estimator | Slope (1.0 = unbiased) | Predicted MWp | Spearman ρ | Reading |
|---|---|---|---|---|
est_mwp_rc_roof |
0.405 | 12,509.7 | 0.628 | Recall-corrected. Germany's readable number |
est_mwp_exp |
0.388 | 13,110.4 | 0.656 | Probability-weighted ceiling |
est_mwp_det |
0.340 | 10,699.6 | 0.661 | Precision-honest floor |
est_mwp_cal |
0.167 | 5,190.2 | 0.651 | Precision-weighted |
Two things are worth taking away, and they point in opposite directions.
Ranking transfers; level does not. Every estimator lands at ρ ≈ 0.63 to 0.66 while slopes span 0.17 to 0.41. The model puts capacity in the right municipalities and gets the amount wrong. That is the same pattern as Pakistan's external comparison, now confirmed against a mandatory register rather than owner-attested quadrats.
No estimator here is close to unbiased. The best-calibrated recovers about 40% of the capacity it could see. Read that as the honest accuracy of segmentation-only detection at 10 m GSD, not as a defect introduced by the calibration work below.
What the register found, twice
The full derivation is in Validating against a complete register. Neither correction would have been visible without a complete reference.
1. p_unmapped was a zero. No instrument existed for P(candidate is real | no OSM
match), so Germany's table shipped 0.0 and priced every unmapped candidate at nothing.
MaStR closes that above 30 kWp, where it publishes per-unit coordinates. Measured per
placement and chance-corrected, rooftop p_unmapped runs 0.061 to 0.759 across the size
bins. est_mwp_cal moved 0.038 → 0.167.
2. That fix exposed a second, opposite error. est_mwp_rc_roof jumped from 0.262 to
3.11 — from understating truth to overstating it threefold. Two errors had been
cancelling, and removing one revealed the other.
The cause was not either hypothesis first written down.
capacity_calibration.derive_placement_tables restricted both sides of the recall
measurement by placement, so a rooftop reference installation only counted as found if the
candidate that found it was itself classified rooftop:
| Rooftop bin | vs same-placement candidates | vs any candidate | factor |
|---|---|---|---|
| 500-1k m² | 0.128 | 0.167 | 1.3x |
| 1k-5k | 0.214 | 0.268 | 1.25x |
| 5k-50k | 0.096 | 0.693 | 7.3x |
| >50k | 0.036 | 0.852 | 23.9x |
Precision and recall are asymmetric. mapped_frac asks "is this candidate real", so its
corroboration must come from references of its own placement. Recall asks "was this real
installation detected at all", and how postprocess labelled the finding candidate is
irrelevant to that. The mechanism explains why the error grew with size: a large array
overruns its imagery-derived VIDA footprint, building_overlap_frac collapses, and a
candidate that correctly found a rooftop installation is classified ground_adjacent or
no_building — the same undersizing the parcel label exists to handle. 1/recall
then inflated those candidates by up to the 20x clamp.
Fixing it moved est_mwp_rc from 114,145 to 24,687 MWp nationally and its slope from
3.11 to 0.405, making it the best-calibrated of the four estimators. est_mwp_det and
est_mwp_exp did not move at all, which is the sanity check: neither uses recall.
Pakistan shares this code and its published figures are overstated
The same restriction understated Pakistani recall: rooftop 0.423 → 0.808 in the
5k-50k bin, 0.065 → 0.952 above 50k, ground 0.107 → 0.417 in 500-1k. Because
1/recall is the multiplier, Pakistan's est_mwp_rc — and therefore its Best
estimate — is too high. Its numbers come from the checked-in calibration table
and do not move until that is deliberately re-derived, which needs the glint sample and
the calibration boxes. That re-derivation has not been run.
Two hypotheses were written down first and both were measured and refuted: that oversize
rooftop reference features deflated the top bin (they recall at 0.841, no different from
the rest) and that count-recall applied to area inflated the estimator (the area/count ratio
is 1.01 to 1.08). Recorded because the wrong diagnosis was the plausible one.
The plausibility gate
check-density is the pre-publication gate for failure modes p_real weighting cannot
catch. Across the runs:
| Original | After p_unmapped |
After the recall fix | After the region dedup | |
|---|---|---|---|---|
| ok | 19 | 17 | 18 | 15 |
| suspect | 1 (Saarland, ground-mount 3.6x rooftop) | 0 | 0 | 0 |
| fail | 0 | 3 (Hamburg, Bremen) | 2 (Hamburg) | 1 (Hamburg) |
The first three columns count 20 rows, the last 16: the region layer carried four duplicate polygons until 2026-09-13 (below), so Hamburg was being failed twice.
Saarland's flag cleared legitimately: it was flagged because ground-mount read 3.6x its
rooftop total, and rooftop capacity rising is exactly the correction that ratio wanted.
Bremen cleared when recall was fixed. Hamburg's remaining failure is structural rather than
a detection — a city-state spanning a handful of 0.1° cells has a top cell holding
31% of its total no matter what. That is the same reading this project already applies to
Islamabad Capital Territory, and the same standing precedent for publishing a
checked-genuine plausibility failure. The ground:rooftop ratio check correctly skipped it (it
requires mwp_ground >= 50; Hamburg has 7.0), while the concentration check has no
equivalent minimum-region-size guard.
A data quirk that turned out to be a real bug, fixed 2026-09-13. plausibility.csv
carried 20 rows for Germany's 16 states, with Hamburg, Mecklenburg-Vorpommern,
Niedersachsen and Schleswig-Holstein each appearing twice. The cause is that Overture
publishes a coastal division twice, once as land and once including territorial waters, and
nothing deduplicated them; each pair is perfectly nested. In plausibility.csv this was
harmless beyond failing Hamburg twice, because every row is an independent per-polygon
estimate. In the evidence atlas it was not. That page assigns capacity to a province by
point-in-polygon on each cell's centroid, so 1,152 of Germany's 4,656 cells fell inside both
rows of a pair: four Bundeslaender were listed twice in "Provinces, ranked by capacity", and
the province column summed to 29,559 MWp against a national 24,687, a 19.7% double-count. The
headline tiers are summed from the grid rather than from the provinces, so no published total
moved.
The fix keeps the land polygon, which is the smaller of a nested pair -- a "keep the largest" rule picks the wrong one every time. Germany's 16 kept polygons total 357,649 km² against the country's actual 357,596 km² of land. The test is geometric nesting rather than a repeated name, so genuinely distinct divisions that share a name are untouched. Only Germany was affected; every other AOI here draws its admin polygons from geoBoundaries, which publishes no maritime outlines.
Does roofclf transfer to Germany
Germany sits between the two regimes this project has measured. French rooftop PV is roughly
20 m² covering an eighth of its roof, where roofclf fails; Pakistani rooftop PV is
roughly 54 m² covering a third, where it works. German OSM rooftop arrays in the cells
tested have a median of 71 m² covering 0.266 of their roof, next to Pakistan's 0.309
and France's 0.119. On the mechanism in
How it works, Germany should
be a regime where the instrument works, and it is.
Three models scored on one shared German set, 45 grid cells and 551,966 buildings:
| Model fitted on | AUC | Within size band |
|---|---|---|
| France, OpenPVMapper labels | 0.704 | 0.625 |
| Pakistan, production model | 0.715 | 0.641 |
| Germany, in-domain (leave-one-cell-out) | 0.792 | 0.688 |
A foreign model does transfer, and it barely matters which one. France's OpenPVMapper fit and Pakistan's production model land within 0.011 AUC of each other, which is a useful negative result on its own: the ranking signal is not country-specific. But an in-domain German fit beats both by about 0.08, so which country the labels come from matters far less than whether any of them are German.
Every number here is a hard lower bound, for two independent reasons, and neither is comparable to Pakistan's 0.857 or France's 0.710, both measured against exhaustively mapped truth:
- German OSM covers ~3.6% of registered rooftop units, so the great majority of true positives sit in the negative class.
- VIDA cannot find the buildings. Of 38,869 OSM rooftop arrays in these cells, 19,623 (50.5%) lie more than 20 m from any VIDA footprint and only 5,410 buildings end up labelled at all, an attribution rate of 13.9%. The measured base rate is 0.98% where the feature count implies 8%.
The second point is the French cadastre finding again, worse. It is also actionable: German
official building footprints and German OSM buildings are both far more complete than VIDA,
and swapping them in is now a one-argument change through building_table's buildings
override.
What this means. Germany is the best remaining candidate for a roofclf half, better than
France by construction and measurable against a complete register. It needs two things first,
and neither is a model change: exhaustively mapped calibration quadrats, because OSM at 3.6%
completeness cannot fit a coverage ratio, and a footprint layer that finds the buildings.
The sub-400 m² estimator against the register
The coverage_ratio and area_recall machinery prices about 88% of Pakistan's published
Best estimate, is fit on 30 purposive quadrats, and had never been checked against an
independent truth, because Pakistan has none. Germany does.
The 30 kWp coordinate cliff does not block this. It stops the p_unmapped precision
instrument reaching below the floor, because individual sub-30 kWp units carry no
coordinates. But this estimator makes no per-building claim; it emits a per-area aggregate,
and an aggregate is exactly what an uncoordinated register publishes completely. The cliff
blocks precision, not calibration.
roofclf was fitted on 30 German pseudo-quadrats (325,933 buildings, median fold AUC 0.824,
0.729 within size band), scored over 709 cells in Baden-Wuerttemberg, Rhineland-Palatinate and
Saarland, and aggregated to municipalities via vg250_gem.parquet. A Gemeinde counts only if
the scored cells cover at least 98% of it, since its register capacity is whole and a
partially scored one would pair truncated area against complete truth.
The result, cross-validated across municipalities, is that a trivial baseline wins.
| Footprints | Estimator | Spearman | Median abs. error | n |
|---|---|---|---|---|
| VIDA | Total roof area x a constant (no model) | 0.965 | 23.0% | 3,133 |
| VIDA | roofclf, probability-weighted | 0.839 | 58.4% | 2,696 |
| OSM | Total roof area x a constant (no model) | 0.959 | 25.1% | 3,144 |
| OSM | roofclf, probability-weighted | 0.787 | 62.8% | 2,584 |
Thresholded variants are worse still, monotonically so as the threshold tightens: at the 90th percentile 43.2% error, at the 95th 48.9%, at the 99th 91.7%.
A matching national total hid all of this. The cross-validated total ratio is 1.003, apparently flawless. Split by decile of predicted capacity, the estimator under-predicts the bottom 90% (decile ratios 0.0 to 0.6) and over-predicts the top decile at 1.8x, and the two cancel. The median municipality receives 47% of its true capacity. A national total that matches is not evidence of correctness; it is the fitted ratio forcing the totals to agree.
Stratification does not earn its keep here. Pooled single ratio 0.839 / 58.1%, size-stratified 0.839 / 59.3%, density-stratified 0.823 / 53.1%, size-and-density 0.808 / 53.2%. The machinery the Pakistani atlas depends on performs no better out of sample than one global number.
A calibrated German estimate, and why it is not in the atlas
Germany's blocker was never the classifier, which ranks roofs perfectly adequately on OSM
labels. It was the capacity half: a coverage_ratio cannot be fitted from labels covering
3.6% of the truth. Germany does not need one. MaStR is complete, so kWp per unit of
credited roof area is fitted directly against the register per municipality, which is a
stronger calibration than a transferred quadrat ratio rather than a weaker one.
The classifier's training mix was chosen by measurement, not assumption, leave-one-German- quadrat-out:
| Training mix | AUC | Within size band |
|---|---|---|
| Germany only | 0.8240 | 0.7290 |
| Germany + France border (cadastre) | 0.8372 | 0.7546 |
| Germany + France national | 0.7384 | 0.6359 |
| France border only | 0.7828 | 0.7152 |
Adding the French border communes helps; adding the French national set actively hurts by 0.086 AUC. Three explanations are confounded and this test cannot separate them: proximity and building stock, cadastre footprints against VIDA, and sheer swamping, since the national set brings 16,435 positives against Germany's 2,252.
Scored over all 4,656 cells, 25.0M assessable buildings, and calibrated on the 9,674 municipalities the grid fully covers (50.4 of 54.3 GWp registered):
| Estimator | kWp/m² (90% CI) | Median municipal error | Spearman | National | vs register |
|---|---|---|---|---|---|
| roofclf, probability-weighted | 0.2793 (0.2654-0.2926) | 48.4% | 0.825 | 52.37 GWp | 0.96 |
| Roof-area baseline | 0.0088 (0.0086-0.0091) | 37.8% | 0.875 | 52.38 GWp | 0.96 |
| MaStR, the truth | 54.29 GWp | 1.00 |
The national extrapolation holds. The constant is fitted only where the grid fully covers a municipality and then applied to every scored building in the country, landing at 96% of the register. The 4% shortfall is extrapolation error, reported rather than absorbed.
The gap to the baseline narrows at national scale but does not close. On the 709-cell regional subset roofclf lost by 35 points of median error; nationally it loses by 11. Both moved: roofclf improved with the better mix, and the baseline degraded from 23.0% to 37.8% once the country included cities and the east, where roof area stops proxying for PV. The regional test flattered the baseline.
This is why the roofclf half is reported here and not folded into the atlas. A component measured as worse than multiplying roof area by a constant does not belong inside a published Best estimate, and the atlas's floor tier needs a roofclf-and-SPPI agreement population that Germany cannot fit for the same 3.6% reason. The atlas therefore stays segmentation-only, and this estimate stands beside it with its own numbers.
Still preliminary. No exhaustively mapped German quadrats exist, so the classifier carries the 3.6% handicap; 10% of buildings had no valid composite pixel and are excluded from BOTH estimators, so these figures cover the assessable roof population rather than every roof; and the model is VIDA-fitted, so refitting on OSM footprints before rescoring remains untested.
Where German roofclf actually loses, and what does not fix it
Four label strategies all landing on the roof-area baseline raised the obvious question of where the shortfall sits. It is not in the classifier's discrimination, which is fine, and it is not in the features.
There is real headroom. Adoption intensity varies 8.5x across German municipalities (5th to 95th percentile: 0.0031 to 0.0266 registered kWp per m² of roof). Roof area alone explains 61% of municipal capacity variance in log space, leaving 39% unexplained.
roofclf captures none of it. The correlation between its credited area and the residual of a roof-area-only fit is +0.007. Whatever the classifier contributes at municipality level was already in "how much roof is here".
Removing roof area from the model changes nothing. log_roof_area is roofclf's strongest
feature, so the natural theory was that size swamps the spectral signal inside
sum(p x roof_area). Tested on 1,101 representative municipalities:
| Feature set | Median municipal error | Spearman | Corr with roof-area residual |
|---|---|---|---|
| Roof area only (baseline) | 34.2% | 0.920 | n/a |
| With size (current) | 33.4% | 0.921 | +0.0080 |
Without log_roof_area |
33.4% | 0.921 | +0.0083 |
| Spectral features only | 33.4% | 0.921 | +0.0083 |
Identical to three significant figures. The theory was wrong.
The reason is that the classifier does not see adoption at municipality scale at all.
Across municipalities whose true adoption intensity spans 4.6x, roofclf's mean probability
spans 0.95x -- flat -- and Spearman between the two is -0.031. Since sum(p x
roof_area) with a near-constant p is just sum(roof_area) times a constant, the estimator
collapses onto its own baseline by arithmetic, whatever features go into p.
That is a more useful failure than "the model is weak". The two scales are decoupled: discrimination within a scene survives at 0.84-0.88 AUC, while the absolute level across scenes carries no adoption information. Two explanations remain, and they imply opposite next steps: per-scene nuisance variation (atmosphere, sun angle, composite epoch) masking a real signal, or genuine blindness at that scale. The discriminating measurement is whether mean probability tracks adoption within a single cell, where scene conditions are shared.
What this rules out: more feature engineering on the classifier. Three feature sets producing identical municipal numbers is strong evidence the problem is not in the features, and a fourth would not change that.
What an OSM solar polygon is actually worth, and what that did not fix
Germany's Verified tier is hand-mapped OSM area times two assumed constants, and the project has carried a note that its ground-mount component reads 118% of all registered German ground-mount. MaStR can settle the constants directly, because it geolocates the placement that matters: 81.2% of ground units carry coordinates (14,357 of 17,674, 37.19 GWp) against 5.2% of rooftop units. A registered unit's coordinate falling inside a dissolved OSM polygon pairs a true capacity with a mapped area.
| Placement | Assumed | Measured | Ratio | Matched |
|---|---|---|---|---|
| Ground | 0.050 | 0.081 | 1.62x | 3,638 polygons, 19.8 GWp |
| Rooftop | 0.180 | 0.081 | 0.45x | 3,165 polygons, 0.65 GWp |
The ground constant is too LOW, not too high, so correcting it alone would push the tier further above the register rather than toward it. The rooftop constant is genuinely too high, consistent with German polygons outlining roofs rather than modules, but it is a biased sample: 5.2% coordinate coverage skewed to units at or above 30 kWp, in a population dominated by sub-10 kWp systems.
The ground polygon population is the real data-quality problem. 73% of German OSM ground area -- 656 of 900 km² -- contains no registered ground unit at all, and registration is mandatory. Broken down by size, corroboration collapses exactly where plausibility does:
| Size band | Polygons | Area | Contains a registered unit |
|---|---|---|---|
| 0-1 km² | 28,471 | 438.4 km² | 13% |
| 1-5 km² | 80 | 161.4 km² | 28% |
| 5-10 km² | 15 | 93.5 km² | 0% |
| 10+ km² | 6 | 207.1 km² | 0% |
Not one of the 21 polygons above 5 km² contains a registered ground unit, and they hold
33% of all German OSM ground area; the largest two are 88.3 and 62.0 km² against a largest
real German solar park of about 5 km². prepare_national_osm_solar.py now drops ground
features above 5 km², a threshold taken from where corroboration reaches zero rather than
tuned to a target.
The cap itself changed no published number. All 21 polygons have representative points outside the density grid, which covers building-populated cells only, so the atlas never counted them: Verified was 38,508.1 MWp before and after, identical to the decimal. (Since 2026-09-15 the atlas can count installations outside its grid, so "outside the grid" is no longer what excludes them — the cap drops them before they reach it, which is why the statement still holds.) The cap is prophylactic, protecting any future run whose grid does cover empty cells. The 118% note was describing a computation the atlas no longer performs -- the national OSM sum is 65.9 GWp at the assumed constants, but Verified reports only the in-grid subset.
Reconciling in-grid OSM: the overstatement was rooftop, not ground
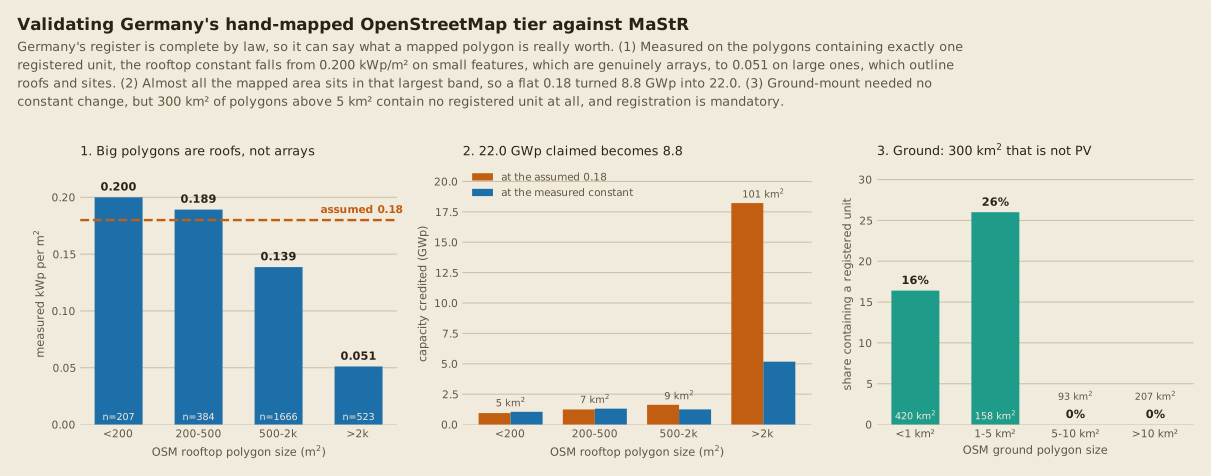
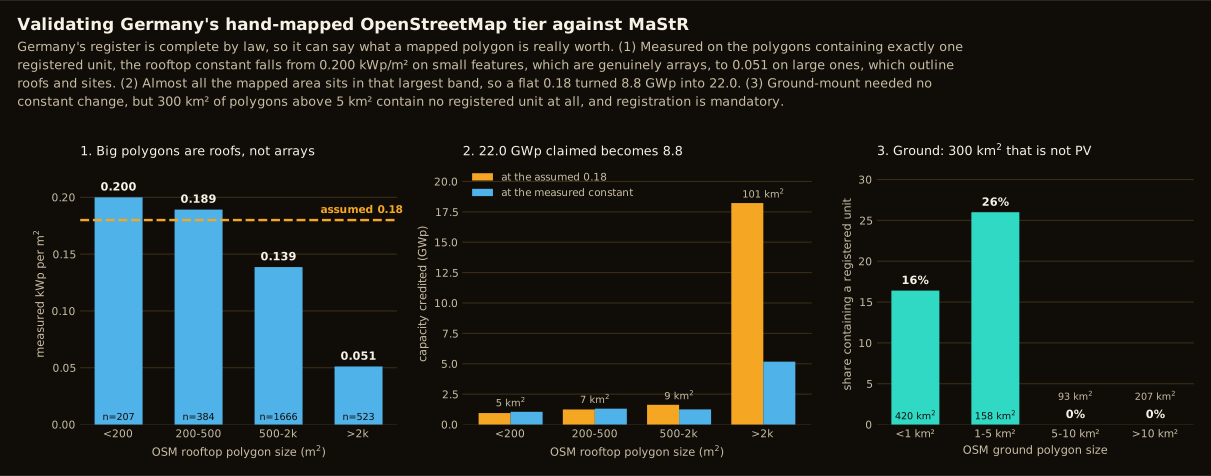
How to read the figure. Panel 1 is the measurement: what a polygon is really worth, by size. Panel 2 is why it matters, because almost all the mapped area sits in the band where the assumption is worst. Panel 3 is a different kind of failure -- ground-mount needed no constant change, but a third of its area is polygons that contain no registered installation at all.
Replicating the atlas's exact population -- dissolved, then filtered to features whose representative point lands in a populated cell -- and asking the register what is actually inside those same polygons:
| Placement | Verified assumed | Register inside those polygons | Ratio |
|---|---|---|---|
| Ground | 17.97 GWp | 19.82 GWp | 0.91 |
| Rooftop | 20.54 GWp | see below | ~2.5x over |
Ground reconciles within 9%. The entire overstatement is rooftop, which inverts the long-standing note that ground-mount was the problem.
The mechanism is that an OSM rooftop polygon is not the same object at every size. Measured on the 2,780 polygons containing EXACTLY ONE registered unit, so a polygon in a dense street cannot collect its neighbours' address points -- unrestricted, sub-200 m² polygons appeared to carry 0.63 kWp/m², three times full module coverage and therefore impossible:
| Polygon size | Measured kWp/m² | German polygons | Area | At 0.18 | At measured |
|---|---|---|---|---|---|
| < 200 m² | 0.200 | 78,809 | 5.3 km² | 0.95 | 1.05 |
| 200-500 | 0.189 | 23,365 | 6.9 km² | 1.24 | 1.31 |
| 500-2k | 0.139 | 9,291 | 9.0 km² | 1.62 | 1.25 |
| > 2k | 0.051 | 4,694 | 101.2 km² | 18.22 | 5.18 |
Small features really are arrays and convert near full module coverage; large ones are roof or site outlines. The damage is concentrated, because 4,694 polygons above 2,000 m² hold 101.2 of 122.4 km² of all OSM rooftop area.
capacity_calibration.osm_rooftop_kwp_per_m2 now applies that table, keyed by AOI: Germany
uses it, and Pakistan, France, Gujarat, Punjab and the unnamed default all return the flat
0.18, verified rather than assumed, so no figure outside Germany moves.
Tier totals move to Verified 25,921 / Best 87,743 MWp (from 38,508 / 94,624), and both placements now sit within about 10% of what the register says is inside the mapped polygons. Two later changes moved them again, and the current published figures are Verified 26,635 / Best 88,709 MWp: the grid was rebuilt with no building-density filter (2026-09-15, 4,656 to 4,871 cells), and the national OpenStreetMap pull was clipped to Germany's border, which removed 249,115 of 475,210 pooled features that were never German at all. Verified is 23% of Germany's 112 GWp of registered PV from OSM mapping 2.6% of units, which is plausible for a subset skewed to large installations where 34% was not.
Both capacity paths use the table. _size_distribution_data, which feeds the size chart,
applies the same conversion as build_evidence_atlas, so the chart cannot disagree with the
headline it sits beneath -- that function's contract is to re-bin the published total, not to
recompute it. The change is currently latent rather than visible: Germany's atlas has no size
chart, because that section is gated on a roofclf >= 400 m² replacement Germany does not
have, and Pakistan, which does have the chart, returns the flat 0.18 at every size.
The remaining caveat is sampling. The matched set is 5.2%-coordinate-limited and skewed to units at or above 30 kWp, so the large-polygon constant is better determined than the small-polygon one.
What the German atlas now carries
The atlas's sub-400 m² half was replaced on 2026-09-13, because the component it carried was the worst of the three measured options.
| Sub-400 m² component | Median municipal error | In the atlas |
|---|---|---|
| roofclf, probability-weighted | 48.4% | until 2026-09-13 |
| Roof area, single constant | 37.8% | no |
| Roof area, 200-400 m² band at 0.03493 kWp/m² | 35.6% | now |
Tier totals moved from Verified 41,937 / Best 61,854 MWp to Verified 38,508 / Best 94,624 MWp. Three things explain that and should be read together.
Verified fell because a regression has nothing to agree with. The old floor tier was the roofclf-and-SPPI agreement population; the replacement has no second detector, so Verified returns to hand-mapped OpenStreetMap alone. That is the honest result rather than a loss: the old floor asserted a standard of proof the new component cannot meet.
Best rose because the band is genuinely uncounted. The 200-400 m² band sits entirely below segmentation's >= 400 m² population, and German OSM rooftop is ~3.6% complete, so deduplication removes very little of it. The component is 52.2 GWp against a registered 54.3 GWp of rooftop at or below 100 kWp, and it is additional to what the other tiers hold rather than overlapping them.
It is an estimate, not evidence. roof area x constant contains no per-building
observation of PV. It reproduces the national total almost exactly, which is unsurprising
since the constant is fitted against that register, and it ranks municipalities better than
anything else tried. Both statements are true at once, and the atlas page says so rather than
letting the tier name imply detection.
None of this fixes the headline problem. The tier totals still fail their own register check, because Verified's ground component alone is 118% of all registered German ground-mount, from OSM mapper convention. That is a different defect from the one this replacement addresses.
The estimator that finally beats the baseline, and what RID corrected about it
Since no supervision scheme moved roofclf past a plain roof-area baseline, the remaining place to look was the estimator rather than the classifier. Splitting each municipality's roof area into size bins and letting the register price each band gives the first thing to beat it:
| Estimator | Median municipal error | Spearman | National total |
|---|---|---|---|
| Roof area, single constant | 37.8% | 0.875 | 1.000 |
| roofclf, single constant (deployed) | 48.4% | 0.825 | 1.000 |
| Roof area in the 200-400 m² band alone | 35.4% | 0.892 | 1.000 |
| Roof area, all bins by NNLS | 32.7% | 0.892 | 0.851 |
| roofclf, size-stratified | 80.5% | 0.823 | 0.348 |
The NNLS variant scores best but its coefficients are degenerate: it puts essentially all weight on the 200-400 m² bin and zero on the other six, because bin areas are strongly collinear across municipalities, and it under-predicts the national total by 15%. The single-band form is the one to use -- barely worse, interpretable, and its national total is intact. Adding roofclf to the stratification makes it dramatically worse, which is the fifth independent line of evidence that the classifier subtracts at municipality scale here.
RID then corrected the reason this works. The relationship underneath it was measured from
German OSM, which covers ~3.6% of registered units and favours large conspicuous arrays -- the
exact bias that could manufacture a spurious size preference.
RID is the control: 1,899 roofs in Wartenberg annotated
exhaustively from aerial imagery, with pvmodule among the superstructure classes, so an
absent module is a real negative.
| Roof size | Roofs | With PV | Adoption rate | Share of all PV area | Concentration |
|---|---|---|---|---|---|
| 0-50 m² | 400 | 12 | 0.030 | 1.6% | 0.40 |
| 50-100 | 324 | 22 | 0.068 | 2.6% | 0.35 |
| 100-200 | 609 | 145 | 0.238 | 23.5% | 0.81 |
| 200-400 | 468 | 143 | 0.306 | 40.6% | 1.05 |
| 400-1k | 84 | 25 | 0.298 | 21.5% | 1.43 |
| 1k+ | 14 | 6 | 0.429 | 10.1% | 1.69 |
The band is confirmed, the explanation was wrong. 200-400 m² roofs really do carry 40.6% of all annotated PV area from 25% of the roofs, so the estimator rests on something real. But adoption rate rises monotonically with roof size (0.030 to 0.429) and concentration is highest in the largest bins. The band dominates because that is where German roofs are, not because large roofs are disfavoured. The earlier reading -- that adoption anti-correlates with roof scale at -0.920, so PV is a small-roof phenomenon -- was measured across municipalities and does not transfer to across buildings; those are different quantities.
RID also prices OSM's bias. Spearman between roof area and installed PV area on PV-bearing roofs is +0.349 against OSM's +0.729, and the median installation on a PV-bearing roof is 14 m². German OSM roughly doubles the apparent coupling between roof size and array size.
What RID is not. It is 1,899 roofs in one Bavarian municipality, 86% residential: enough to settle a bivariate relationship, not to fit national intensity coefficients, and not a fix for roofclf, whose German problem is measured not to be a labelling problem at all. It is listed in the country data registry as roof-context supervision, and that is the right reading of it.
Calibrating Germany without a mapped quadrat: the whole picture
Germany has no exhaustively mapped calibration boxes, and mapping some was the obvious prescription. It turned out not to be the binding constraint, and the route that worked instead is worth laying out in one place.
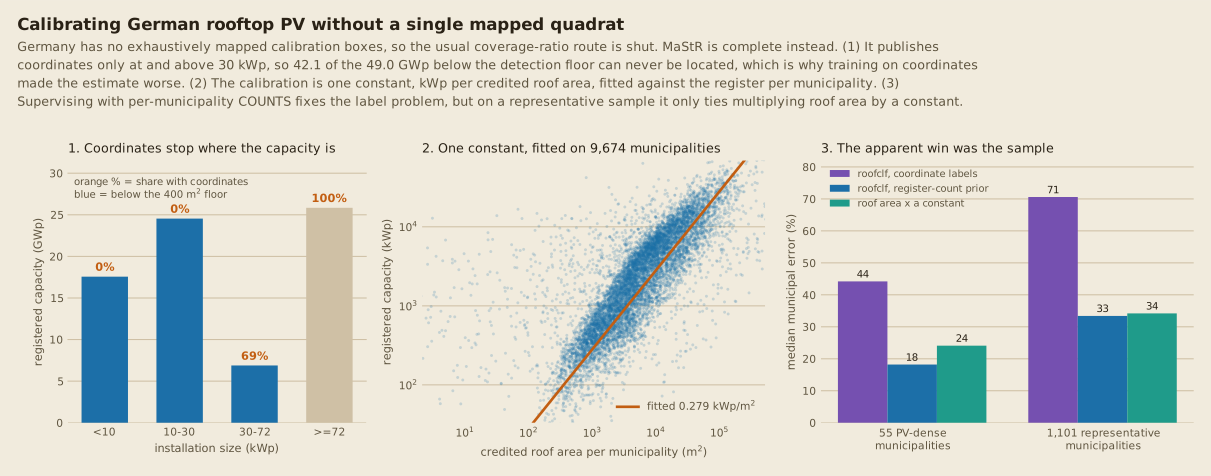
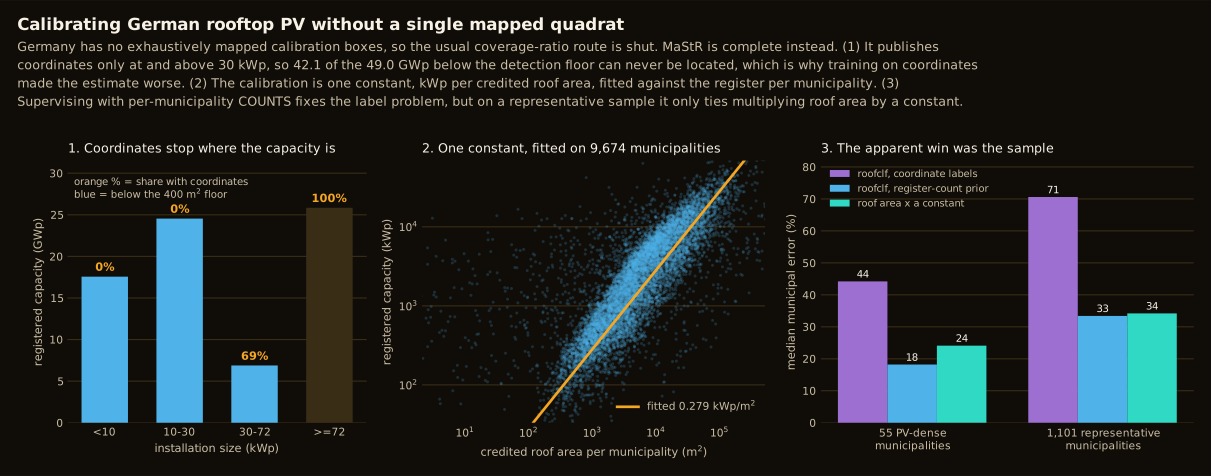
The constraint was never the classifier. roofclf ranks German roofs perfectly adequately
on OSM labels, at 0.824 AUC. What it could not do was fit a coverage_ratio, because you
cannot measure the true PV area on a flagged roof from labels covering 3.6% of the truth.
MaStR replaces the quadrat, because the estimand is an aggregate. The estimator emits a per-area capacity total, and a complete register publishes exactly that per municipality. So the calibration is one constant, kWp per unit of credited roof area, fitted directly against the register across 9,674 fully covered municipalities: panel 2. That is a stronger calibration than a transferred quadrat ratio, not a weaker one, and it needs no mapping at all.
Three ways of supervising the classifier were then tried, and the register's coordinates are the wrong one. Panel 1 is why: coordinates begin at 30 kWp, so 42.1 of the 49.0 GWp below the detection floor can never be located. Training on them produced a better classifier (0.8792 AUC against 0.8563) and a worse estimate (63.9% municipal error against 48.4%), because the labels and the estimand disagree about which installations matter.
Per-municipality counts fix the label problem. MaStR publishes exact rooftop unit counts for all 11,024 Gemeinden, 4.41M units spanning every size band including the 4.13M that carry no coordinates. That is a known class prior, and positive-unlabelled training against it beats coordinate labels by a wide margin: 33.4% municipal error against 70.6%, on a set where only 1.9% of register units are coordinate-labelled.
But it does not beat the trivial baseline, and the first result that said otherwise was a sampling artefact. On 55 PV-dense municipalities the prior scored 18.2% against the roof-area baseline's 24.1%, which looked decisive. Those municipalities had a 27.0% PV base rate against Germany's national 15.9%, selected that way because they were chosen to maximise geolocated units. Repeated on 1,101 municipalities at a representative 14.9% base rate, the gap closes to 33.4% against 34.2%, with Spearman identical at 0.921 and 0.920: a tie.
What Germany settles. Four approaches -- OSM labels, register coordinates, a known per-municipality prior, and authoritative footprints -- and none beats multiplying total roof area by a constant at municipality level. Where rooftop PV is near-ubiquitous, roof area is close to sufficient and per-building discrimination washes out under aggregation. In Pakistan, where adoption is rare and concentrated, the same estimator cuts median error 3.4x against the same baseline. The instrument is not broken; the regime decides whether it has anything to add.
Register labels: a better classifier that makes a worse estimate
Germany's roofclf trains on OSM labels marking ~3.6% of registered rooftop units, so the obvious suspicion was that label noise explained why it correlates with roof area and loses to a roof-area baseline. MaStR can test that directly: it publishes coordinates at and above 30 kWp, giving 108,443 geolocated rooftop units in the 30-72 kWp band, register-certain and inside roofclf's own sub-400 m² domain. 120 cells were relabelled from the register (1,493,881 buildings, 9,901 matched positives) and the model refitted, changing nothing else: same features, same VIDA footprints, same 4,656 scored cells, same calibration harness.
| Building AUC | Municipal median error | Spearman | National | |
|---|---|---|---|---|
| OSM-labelled | 0.8563 | 48.4% | 0.825 | 52.37 GWp |
| Register-labelled | 0.8792 | 63.9% | 0.803 | 52.31 GWp |
| Roof-area baseline | n/a | 37.8% | 0.875 | 52.38 GWp |
| MaStR, the truth | 54.29 GWp |
Cleaner labels made the classifier better and the capacity estimate worse, by 0.023 AUC and 15.5 points of municipal error respectively.
The cause is a band mismatch rather than anything subtle. The register geolocates only 30-72 kWp, which is 6.9 of the 49.0 GWp below the segmentation floor, so the refitted model is sharply tuned to the largest arrays in the band while the truth it is scored against is dominated by the 42.1 GWp of sub-30 kWp installations that carry no coordinates at all. OSM's labels are noisy but span the whole size range, so their signal tracks total municipal capacity better despite being far less accurate per building.
Two things follow. Optimising building-level AUC on a label subset that does not match the estimand can move the aggregate confidently in the wrong direction, which is worth remembering anywhere a classifier is tuned on one population and summed over another. And the label-noise explanation for roofclf losing to the baseline is substantially weakened: better labels made it worse, so the shortfall is not mainly noise.
The national total was 0.96 for all three models, whose municipal errors span 37.8% to 63.9%. That is the clearest available demonstration that a national figure agreeing with a complete register says nothing about whether the per-cell geography is right.
What this does point to is supervising the capacity-dominant population directly. MaStR publishes exact rooftop unit COUNTS for all 10,757 Gemeinden, covering every band including the 4.13M uncoordinated sub-30 kWp units: a known class prior per municipality rather than a geolocated subset. That has not been tried.
Why this does not condemn the method
The same comparison on Pakistan's 29 Rule-1-complete quadrats, leave-one-quadrat-out, reverses it:
| Country | Adoption regime | Null model | roofclf p-weighted |
|---|---|---|---|
| Pakistan | rare, ~2-14% base rate | 88.9% error | 26.5% |
| Germany | near-ubiquitous | 23.0% | 58.4% |
roofclf cuts median error 3.4x against the null in Pakistan. The reversal is interpretable rather than mysterious: where PV is rare, total roof area says almost nothing about which municipalities hold capacity and a per-building classifier adds a great deal; where nearly every suitable roof carries PV, "capacity is proportional to roof area" is close to true by construction.
So the sub-400 m² machinery is validated in the regime it was built for, for the first time, and Germany's failure has two sufficient explanations that both point away from the estimator being broken.
What is honestly still open
The German classifier is handicapped. It is fitted on OSM labels that mark ~3.6% of registered rooftop units, so its probabilities are poorly calibrated in absolute terms. Its LOQO-fitted deployment threshold came back as 1.9994 with zero buildings flagged, because a 0.5 precision target is unreachable when most true positives are unlabelled; the validation therefore weights roofs by probability rather than thresholding them.
The OSM footprint pass is confounded. The model was fitted on VIDA-based tables and then
applied to OSM footprints, whose median roof is 92 m² against VIDA's 159. Since
log_roof_area is the strongest single feature, that is a distribution shift, not a clean
test of whether better footprints help. Refitting on OSM tables before rescoring is the
missing run.
Two findings do transfer. Thresholding is worse than probability-weighting in both countries, consistently and by a wide margin. And a national total agreeing with a register says nothing about per-cell accuracy, which is what a PyPSA disaggregation actually consumes.
What this run opens up
Both remaining items are tracked on Open questions.
MaStR also records installed pose, uncensored (item 11). glint_opportunity.py documents
its pose prior as necessarily assumed, because this project's own pose survey was fitted
from observed glints and is therefore censored by construction. The register carries azimuth
and tilt for 97.4% of 4.44M rooftop units, of which 225,138 also have coordinates. Checked
against the assumed prior it is far too narrow: 23.8% of German units are pitched steeper
than 40° where the prior implies 3.04%.
France, not Germany, is the place to check the small half (item 4). The 30 kWp coordinate
cliff means this register can say nothing about the sub-400 m² population, which is
where roofclf operates and where the evidence is still 30 purposive Pakistani quadrats.
DeepPVMapper and BDAPPV cover exactly that band in France.
Reproducing this
# compose is the long pole (~4,700 cells at ~35 cells/h). LimitNOFILE must be the
# soft:hard PAIR -- a bare 65536 sets only the hard limit, leaves the soft limit at
# 1024, and compose dies repeatedly on "Too many open files".
systemd-run --user --unit earthpv-compose-germany --working-directory=$PWD \
  --property=Restart=on-failure --property=LimitNOFILE=65536:65536 \
  bash -c '.pixi/envs/default/bin/python -m earthpv.cli compose --aoi germany \
           --use-vida --workers 5 --window 2025-04-01:2025-09-30'

pixi run -e ml earthpv infer --aoi germany --checkpoint <ckpt>
pixi run earthpv postprocess --aoi germany --threshold 0.3

# Measure p_unmapped from geolocated MaStR units, then feed it to the calibration.
# Without this Germany's table carries p_unmapped = 0.0 and est_mwp_cal is a floor.
pixi run python scripts/mastr_p_unmapped.py --base-rate-cells 150
pixi run earthpv calibrate-candidates --aoi germany \
  --mastr-p-unmapped results/germany_mastr_p_unmapped.csv

pixi run earthpv density --aoi germany --districts --force
pixi run earthpv check-density --aoi germany
pixi run earthpv validate-mastr --aoi germany --solar-path <national OSM solar pull>

# The atlas is no longer written by `density`. A raw rooftopsenti OSM pull has no
# `placement` column, so it is prepared first; omitting the --sub400-* pair selects
# the segmentation-only evidence atlas.
pixi run python scripts/prepare_national_osm_solar.py --aoi germany
pixi run earthpv atlas --aoi germany \
  --osm-solar data/labels/germany_national_osm_solar.parquet
The composite window must match the register cutoff (2025-04-01:2025-09-30 against a
2025-09-30 cutoff); the compose default is a Punjab dry season, which is German winter.
See Setup New Country for the full runbook.