Pakistan capacity map
How much rooftop solar does Pakistan actually have? This atlas gives this project's own best defensible estimate, reading detections from two instruments, split by placement and by calibration coverage rather than cleanly by size: a segmentation model that outlines individual arrays directly (every mapping lead, all ground-mount capacity at any size, and rooftop capacity 400 m2 and larger outside the cells covered below), and roofclf, a per-building classifier cross-checked against the zero-training SPPI index, which covers every rooftop below 400 m2 -- where segmentation is trained blind -- and also replaces segmentation's own rooftop estimate at or above 400 m2 inside the cells its calibration quadrats cover, where it measures better. See "Segmentation vs. roofclf on large rooftops" below for the comparison that motivated the swap.
The map itself lives on its own page: open the Pakistan PV Atlas. Interactive, full width, with a country switcher. Hover a cell for its value, and see "Download the underlying data" at the bottom of it for capacity parquets, calibration boundaries, the pose survey, raw detections and the model checkpoint. This page is the written account of how that map is derived and what it does not claim.
See also capacity by installation size, the same total split rooftop vs ground-mount by how large each installation is, instead of by geography.
The headline figure
Best estimate: 24,330.0 MWp (90% range 20,822 – 33,582). It combines every installation a person has drawn in OpenStreetMap (15,642 of them, deduplicated -- see "Ground-mount capacity" below) with ≥400 m2 capacity (roofclf's own rooftop estimate inside the density-matched cells, segmentation's recall-corrected rooftop detections everywhere else, segmentation's ground-mount detections throughout) and the roofclf per-building density estimate for sub-400 m2 buildings inside the same cells. Every component is measured inside the density-calibrated domain: an out-of-domain roofclf-AND-SPPI extrapolation was tested and dropped from the published atlas (see "Calibration coverage" below).
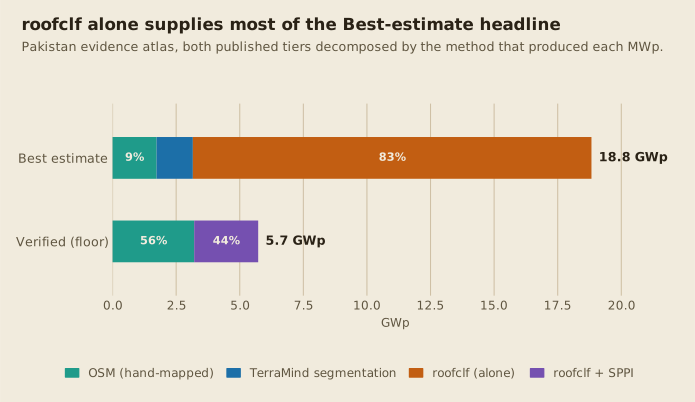
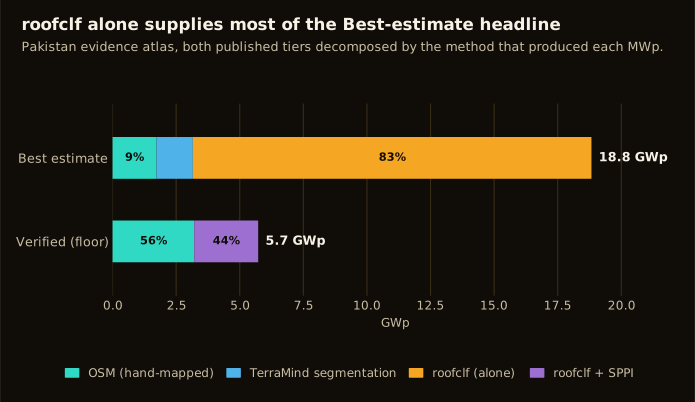
SPPI no longer contributes to Best at all; its role is in the internal floor (6,970.7 MWp), where it is now larger than all of hand-mapped OSM put together. Full per-component breakdown, with credible intervals on every slice: capacity composition.
How confident should you be in this?
The 90% range is composed from three measured sources: the two area-to-capacity constants' priors, segmentation's own precision/recall posterior by installation size, and the coverage ratio's sensitivity to which calibration quadrats happen to have been mapped (measured by resampling the quadrats themselves, not the buildings inside them). It does not include a design-based sampling error, because the quadrats were hand-picked rather than randomly drawn. It also does not cover the gap between where the coverage-ratio/area-recall correction is fit and where it is applied -- as of the current fit, roughly 5% of published Best is priced by a multiplier whose sparsest supporting quadrat is several times denser than the cells it is applied to. See Calibration density mismatch for the full measurement, "How confident should you be in this?" on the atlas page, and validation against MaStR for what a complete register can and cannot settle here.
The sub-400 m2 population is split into two populations of differing strictness: a more permissive one (roofclf alone, feeding the figure above directly) and a stricter one requiring roofclf and SPPI to both agree -- two independent detectors, not one model trusted alone -- used internally as a floor so the headline figure never reads below what a person has actually mapped plus that stricter population. Neither double-counts, on either axis: OpenStreetMap-mapped installations are matched by location and removed from the model-detected side before summing, and the sub-400 m2 instrument itself drops any building within 30 m of an OpenStreetMap solar feature, not just those near an existing segmentation candidate. Best is also floored, per cell, at what a person has actually mapped plus the stricter (AND-gate) population, so a cell where the model's own estimate happens to read low never publishes below what is already confirmed on the ground.
This is a research methodology under active validation, not a finished census
All 30 ground-truth calibration quadrats are Rule-1 complete (every visible panel independently verified against the mapping imagery's own capture date), and the density-matched calibration domain covers 2,957 of Pakistan's 4,463 grid cells (66.3% of cells, 94.7% of buildings). roofclf's own measured skill still varies by quadrat and its predicted rate does not reliably separate well-calibrated cells from over-predicting ones -- see Capacity density for what is independently corroborated and what is still open.
Why roofclf replaces segmentation on large rooftops too
Segmentation is trained to outline a polygon, and at Sentinel-2's 10 m ground sampling distance a small array on an otherwise large roof does not have a resolvable one -- segmentation is a known weak instrument for small PV, including this population. Measured on the calibration quadrats' own ≥400 m2 buildings, roofclf discriminates real PV far better than segmentation's own raster probability there (AUC 0.896 vs 0.73-0.78, recall 94.2% vs 19-25% at matched precision). So roofclf replaces segmentation's own rooftop estimate for ≥400 m2 buildings inside the density-matched cells; segmentation's own rooftop total stays in force outside that domain, and its ground-mount total is unaffected everywhere, since roofclf has no footprint to score for ground-mount. See "Segmentation vs. roofclf on large rooftops" below for the full comparison.
Ground-mount capacity
OSM ground-mount solar features are dissolved before being summed (labels.dissolve_overlapping):
a power=plant perimeter with a nested power=generator way, or duplicate mapping passes,
would otherwise double-count the same real installation. The ground-mount site-area
conversion constant (DEFAULT_KWP_PER_M2_LAND, 0.05 kWp/m2) is calibrated
against two real Pakistani plants (Quaid-e-Azam Solar Park, 400 MW / 8.9M m2;
Sukkur, 150 MW / 2.6M m2), and rooftop and ground-mount are calibrated as
separate placement strata rather than pooled, since pooling lets ground-mount borrow
rooftop's much higher OpenStreetMap corroboration rate in the same size bin. Together
these keep ground-mount from being overstated relative to rooftop -- see
"Segmentation: the part of this that outlines panels" below for the current national
segmentation total these constants produce.
The area-recall correction
Every roofclf capacity figure multiplies flagged roof area by the measured coverage ratio (true mapped PV area over flagged roof area), which by itself books zero capacity for every installation sitting on a roof roofclf missed. This is corrected the same way segmentation's own recall correction has always worked: each flagged building stands in for the roofs of its size and density stratum that PV sits on but roofclf did not flag, using the measured share of true mapped PV area that lands on a flagged building -- 0.808 for sub-400 m2 buildings and 0.978 for ≥400 m2 ones, rising from 0.34 in the smallest decile of PV-carrying roofs to 0.99 in the largest. Coverage ratio and area recall are refit inside the same bootstrap replicates, since they share the same quadrats and labels and their errors are strongly dependent.
The correction is a lower bound on itself in three ways: Rule-1 completeness is relative to the mapping imagery's own epoch, so it biases measured recall up (and this correction down); the national population being corrected has already been deduplicated against segmentation and OpenStreetMap while recall is measured over a whole quadrat; and a bin measured below 0.10 is floored there rather than trusted, capping the inflation at tenfold. The internal floor (Verified) and the AND-gate tiers are deliberately not corrected this way -- a tier built by requiring two independent detectors to agree stops being a floor the moment it extrapolates to installations neither of them saw.
The parcel label
roofclf counts PV in a building's yard, not only on its roof. The
parcel label adds mapped
PV within 20 m of a footprint, attributed whole to its single nearest building, for
installations below the 400 m2 segmentation floor only (above that floor
ground-mount is segmentation's instrument and the atlas already counts it there). Most of
what this recovers is not ground-mount: across the 30 quadrats, 20% of the added area is
OSM placement=ground and 80% is mapped rooftop PV whose polygon extends past an
imagery-derived building footprint that is undersized or a metre or two off -- a real
undercount rather than ground-mount, and self-consistent to correct, because the same
undersizing shrinks the calibration denominator and the national flagged roof area alike.
Both capacity summaries carry a parcel_label_composition block reporting this split. A
companion feature block (the same zonal statistics computed over a yard ring) was
measured and rejected: it loses to the roof-only feature set even against the parcel
label it was built to serve (0.8712 vs 0.8734 median fold AUC), because the term it
exists to explain is under 2% of quadrat PV area. See
small ground-mounted PV for what that
instrument can and cannot reach.
Calibration coverage
All three roofclf capacity functions only speak for cells whose building density falls inside the calibrated domain -- currently 2,957 of Pakistan's 4,463 cells (66.3%, 94.7% of buildings), fit from the density span of every Rule-1-complete calibration quadrat. A quadrat only widens this domain if its own average density reads below the current floor, which a boundary drawn around a settlement rarely does -- widening it further needs quadrats deliberately sized to include the farmland between settlements. Full derivation and the history of every widening step: Calibration quadrats and Calibration boxes log.
Outside this domain, roofclf-AND-SPPI agreement can substitute as a standard of evidence
(sub400_capacity.out_of_domain_and_gate_capacity, --sub400-outdomain-cells), but it is
not published: it was the one Best-estimate component not measured where it was
applied (a coverage ratio fit on urban/semi-urban quadrats, extrapolated onto a much
sparser rural remainder with no calibration coverage of its own), and manual JOSM review
of that population is blocked by reference imagery too old to confirm recently-installed
small PV. The capacity function and CLI flag still exist for anyone who wants that
estimate explicitly; see Experiments for the full measurement.
What this map cannot tell you, and what an independent estimate confirms it can
The absolute total is a modelled estimate, not a metered figure, and resolution is
the reason. Sentinel-2's 10 m pixels make an individual array smaller than roughly
400 m2 a mixed-pixel problem rather than a shape you can outline -- the
segmentation model is not even trained to try below that floor. Everything under it is
covered instead by roofclf, a per-building classifier cross-checked against the
zero-training SPPI index, restricted to the cells whose building density resembles the
hand-mapped calibration quadrats it was measured on. That restriction is deliberate --
it is what keeps the sub-400 m2 numbers honest -- but it also means the total
depends on calibration coverage, not on a direct count, and the 90% range on the headline
figure above exists specifically to keep that uncertainty visible rather than hidden behind
one bare number.
Given that, a natural question is whether the map is even pointed at the right places -- and a comparison against an independent, separately produced national rooftop-solar estimate says yes, at the level that matters. The two are not in comparable absolute units (different methodology, different sensor resolution, likely a different working definition of what counts as rooftop solar), so diffing raw magnitudes would answer a question neither side can actually settle. Both were instead normalized to percent of the national total per spatial unit and compared: not "whose number is bigger," but "do the two agree on where PV concentrates."
They do, for most of the country. Across the reference's 3,303 hexagons, the median absolute difference in national-share allocation is 0.005 percentage points, and 64% of hexagons land within ±0.02pp of each other (83% within ±0.05pp). Rank correlation (Spearman) is 0.84 including the many hexagons both sides agree carry essentially nothing, or 0.75 restricted to just the 1,759 hexagons (53%) this project actually places a detection in -- either way, strong agreement on the geography.
That agreement is not uniform, though, and the exception is worth stating plainly: a small number of hexagons account for almost all of the remaining difference, and every one of the twenty largest discrepancies runs the same direction -- this project's estimate concentrates more of the national share into a handful of hotspot cells than the independent reference does (up to +4.5pp in the single largest case), never the reverse by nearly as much (the most negative hexagon is -0.16pp). That skew is why the straightforward linear correlation on share is a moderate 0.45 (a log-compressed version, less sensitive to those few large values, rises to 0.54) even though the rank correlation and the typical hexagon's near-exact agreement both say the two models are looking at the same country. Read it as two independently-built estimates agreeing closely on geography and disagreeing about how much weight the largest sites deserve -- not as a validation of one against the other, since neither is ground truth here.
Reproducible with scripts/pv_reference_share_comparison.py, which reads this project's
side straight out of the published Best-estimate figures per grid cell and normalizes
both sides the same way described above.
Segmentation vs. roofclf on large rooftops
Measured on the calibration quadrats' own ≥400 m2 buildings (5,004 of them,
13 quadrats, leave-one-quadrat-out): roofclf's per-building score reaches AUC 0.896
against segmentation's own raster probability at 0.726-0.775 (checked against both
the undocumented checkpoint roofclf's code defaulted to and v3_combined_india, the
actual production checkpoint -- the production one scores slightly better of the two,
so this is not an artifact of comparing against a weaker model). At matched ~54%
precision, per-building recall is 94.2% (roofclf) against 19-25% (segmentation).
Segmentation's blind spot is specifically small PV -- and that includes a small array on
an otherwise large roof, which a building-size filter alone does not screen out.
roofclf's rooftop capacity (roofclf_ge400_capacity.py) now replaces segmentation's own
rooftop estimate inside the density-matched cells (2,957 of Pakistan's 4,463, 66.3%) for
exactly this reason; ground-mount has no building footprint for roofclf to score, so it
stays segmentation-only everywhere.
Segmentation: the part of this that outlines panels
The ≥400 m2 segmentation total (4,052 MWp, [1,894 to 3,402] rooftop-only credible interval once split by placement) is still the source for ground-mount capacity everywhere and for rooftop capacity outside the density-matched domain (see above for the in-domain rooftop swap). A recall-first TerraMind checkpoint reads a year of Sentinel-2 imagery across every building-populated cell, and pixels above threshold are polygonized, joined to a building footprint, and reweighted by a measured probability of being real before their area is counted. Rooftop and ground-mount candidates convert to capacity at different rates, because a rooftop detection outlines the panels while a ground-mount detection outlines the site -- see Capacity density for both derivations, and Growth for how this same instrument changed between the 2021/22 pre-boom epoch and now.
Using it in an energy model like PyPSA
The density stage writes three layers under data/predictions/<aoi>/density/:
buildings.geoparquet-- one row per building carrying PV signal, with roof area, PV area under each metric, estimated kWp and rooftop or ground placement.grid.csvandgrid.geoparquet-- one row per 0.1 degree cell. Thelon_centerandlat_centercolumns map straight onto atlite or PyPSA-Earth cutout grids and Voronoi bus regions.regions.*-- per province, and with--districtsper ADM2, additive totals with credible bands rebuilt from summed posterior draws.
Bin-level uncertainty is fully correlated across cells, so a regional interval must be built from summed draws. Adding per-cell bounds gives the wrong answer.
Reproducing this map
This is EarthPV's main workflow, end to end: the ≥400 m2 segmentation half, then the < 400 m2 roofclf half, then the atlas that combines them.
# >= 400 m² segmentation half
pixi run earthpv calibrate-candidates --aoi pakistan
pixi run earthpv density --aoi pakistan --districts
pixi run earthpv check-density --aoi pakistan   # gate: exits non-zero on an implausible region

# < 400 m² roofclf half -- needs mapped calibration quadrats first, see
# calibration-mapping-protocol.md. roofclf-score-national is the long pole (hours at
# country scale) and is resumable per cell like density.
pixi run earthpv roof-classifier --aoi pakistan
pixi run earthpv roofclf-score-national --aoi pakistan
pixi run earthpv sub400-capacity --aoi pakistan \
    --osm-solar data/labels/pakistan_overpass_solar.parquet

# roofclf's >= 400 m² rooftop swap -- same national scoring pass, just the large-building
# slice; replaces segmentation's rooftop estimate inside the same density-matched cells
# sub400-capacity already restricts to.
pixi run earthpv ge400-roof-capacity --aoi pakistan \
    --osm-solar data/labels/pakistan_overpass_solar.parquet

# Evidence atlas (Best estimate), combining all three.
pixi run earthpv atlas --aoi pakistan \
    --osm-solar data/labels/pakistan_overpass_solar.parquet \
    --sub400-low-cells     data/roofclf_national_with_sppi/pakistan/density/sub400_low_incremental_buildings.parquet \
    --sub400-central-cells data/roofclf_national_with_sppi/pakistan/density/sub400_central_incremental_buildings.parquet \
    --ge400-roof-cells     data/roofclf_national_with_sppi/pakistan/density/ge400_roof_incremental_buildings.parquet
--sub400-outdomain-cells is deliberately not passed: the published atlas reports only
components measured where they are applied (see "Calibration coverage" above). Passing
data/roofclf_national_with_sppi/pakistan/density/sub400_outdomain_and_gate_incremental_buildings.parquet
adds roofclf-AND-SPPI agreement outside the density-matched domain to Best instead, as a
strict extrapolation marked with its own dotted cell outline.
Neither density nor roofclf-score-national needs a GPU or retraining; both run on
rasters already on disk, each taking roughly two hours single-process for all of
Pakistan, and both are resumable per cell. See Setup New
Country for the stages that produce those rasters in
the first place, and Capacity density for how roofclf/SPPI
and the OSM pull that feed the evidence atlas are themselves built.